Notice: Function _load_textdomain_just_in_time was called incorrectly. Translation loading for the updraftplus domain was triggered too early. This is usually an indicator for some code in the plugin or theme running too early. Translations should be loaded at the init action or later. Please see Debugging in WordPress for more information. (This message was added in version 6.7.0.) in /home/aonyeani76/cryptocurrencypanther/wp-includes/functions.php on line 6131
Notice: Function _load_textdomain_just_in_time was called incorrectly. Translation loading for the hustle domain was triggered too early. This is usually an indicator for some code in the plugin or theme running too early. Translations should be loaded at the init action or later. Please see Debugging in WordPress for more information. (This message was added in version 6.7.0.) in /home/aonyeani76/cryptocurrencypanther/wp-includes/functions.php on line 6131
Notice: Function _load_textdomain_just_in_time was called incorrectly. Translation loading for the wpforms-lite domain was triggered too early. This is usually an indicator for some code in the plugin or theme running too early. Translations should be loaded at the init action or later. Please see Debugging in WordPress for more information. (This message was added in version 6.7.0.) in /home/aonyeani76/cryptocurrencypanther/wp-includes/functions.php on line 6131 Theory – Cryptocurrencypanther
https://cryptocurrencypanther.com
Latest Crypto NewsThu, 09 Apr 2026 19:38:45 +0000en-US
hourly
1 https://wordpress.org/?v=6.9.4https://cryptocurrencypanther.com/wp-content/uploads/2021/07/cropped-Cryptocurrency-e1626714913653-32x32.pngTheory – Cryptocurrencypanther
https://cryptocurrencypanther.com
3232Ethereum Hitting A Bottom Or A Bearish Continuation? The Cycle Theory That Tells A Story
https://cryptocurrencypanther.com/2026/04/09/ethereum-hitting-a-bottom-or-a-bearish-continuation-the-cycle-theory-that-tells-a-story/
https://cryptocurrencypanther.com/2026/04/09/ethereum-hitting-a-bottom-or-a-bearish-continuation-the-cycle-theory-that-tells-a-story/#respondThu, 09 Apr 2026 19:38:45 +0000https://cryptocurrencypanther.com/2026/04/09/ethereum-hitting-a-bottom-or-a-bearish-continuation-the-cycle-theory-that-tells-a-story/
Trusted Editorial content, reviewed by leading industry experts and seasoned editors. Ad Disclosure
Crypto market analyst Tony Severino took to X this week to explain the current Ethereum (ETH) cycle. The analyst highlighted how different this market cycle has been playing out, withETH experiencing a prolonged corrective phase that is taking most investors and traders by surprise. Despite ongoing price volatility andbear market trends, Severino notes that Ethereum has yet to reach its final bottom, suggesting the possibility of further downside before a price floor is reached.
Analyst Explains Market Using Ethereum Cycle Theory
On April 7, Severinoshared his Ethereum price analysis on X, comparing the current market cycle with past trends. The analyst noted that crypto cycles can run their full course withoutreaching a new all-time high. Additionally, he said that some cycles may only experiencebear market rallies, in which prices consistently form higher lows and lower highs over time.
According to Severino, the biggest challenge most market participants face today is the inability to accept that a cycle may behave differently from historical trends. He added that, currently, many investors believe the Ethereum cycle has not happened, even though it behaved unexpectedly.
Explaining this deviation through a cycle theory, Severino noted that within a full market cycle, there are several smaller degree cycles that make each timeline unique. He referred to these smaller cycles as “intracycle harmonics.” The analyst emphasized that the behavior of these harmonics can change depending on their position within the larger degree cycle. He further added that if an intracycle harmonic exceeds the amplitude of the larger-degree cycle, it could be a warning sign that ETH is in a period dominated by bear-market rallies.
Essentially, Severino suggests thatEthereum’s recent price gains may be temporary or misleading. Even when it seems to be rallying, the broader market structure implies that these moves are likely part ofa prolonged weak cycle within a bear market. This means that investors should be cautious about expecting a new all-time high anytime soon.
Ethereum Bottom Not Reached Yet
In his analysis, Severinonoted that despite ongoing bearish headwinds and weak action, the Ethereum pricehas not reached a market bottom yet. In his accompanying chart, he highlighted a pink line above the $2,000 level where ETH is currently holding firmly.
According to the analyst, every time Ethereum has broken this key support line, the cryptocurrency has declined to its market bottom. With ETH’s price now hovering slightly above key support, it suggests that the market could be approaching a floor soon.
Before reaching that point,Ethereum will likely experience another downturn. In his chart, Severino identifies $800 and a level around $440 as ETH’s next potential breakdown target or ultimate price bottoms if it falls below the critical line.
ETH trading at $2,181 on the 1D chart | Source: ETHUSDT on Tradingview.com
Featured image from iStock, chart from Tradingview.com
Editorial Process for bitcoinist is centered on delivering thoroughly researched, accurate, and unbiased content. We uphold strict sourcing standards, and each page undergoes diligent review by our team of top technology experts and seasoned editors. This process ensures the integrity, relevance, and value of our content for our readers.
]]>https://cryptocurrencypanther.com/2026/04/09/ethereum-hitting-a-bottom-or-a-bearish-continuation-the-cycle-theory-that-tells-a-story/feed/0Elliot Wave Theory Says Bitcoin Price Is Headed To $40,000, But The End Game Will Shock You
https://cryptocurrencypanther.com/2026/03/03/elliot-wave-theory-says-bitcoin-price-is-headed-to-40000-but-the-end-game-will-shock-you/
https://cryptocurrencypanther.com/2026/03/03/elliot-wave-theory-says-bitcoin-price-is-headed-to-40000-but-the-end-game-will-shock-you/#respondTue, 03 Mar 2026 15:17:48 +0000https://cryptocurrencypanther.com/2026/03/03/elliot-wave-theory-says-bitcoin-price-is-headed-to-40000-but-the-end-game-will-shock-you/
A technical analyst known as ‘V’ has shared a strikingElliott Wave Theory-based Bitcoin price outlook on X that he believes most market participants are completely overlooking. The chart, plotted on Bitcoin’s weekly timeframe, outlines a multi-year roadmap that could first subject the cryptocurrency to significant downside pressure, potentially triggering a price crash to $40,000 before setting the stage foran explosive rally that could shock investors and traders.
Elliott Wave Pattern Points to $40,000 Bitcoin Price Dip
V’s analysis on X begins by identifyinga completed five-wave structure that carried Bitcoin from its 2022 lows to an early 2025 peak around $109,354. Those waves, clearly labeled 1 through 5 on the chart, mark the end of Bitcoin’s first major impulse move.
Related Reading
From here, V projects that Bitcoin could now entera Wave 2 correction, which could take the form of a classic ABC zigzag pattern. In this projected scenario, Wave A is forecasted to bottom somewhere between the 50% and 61.8% Fibonacci retracement levels, triggering a Bitcoin price decline to the $51,000 to $62,000 range.
Following this, Wave B is expected to see a small relief bounce, pushing Bitcoin back up toward the 100% to 132% extension zone between $109,354 to $120,594 on the chart. Once this bounce occurs, V predicts a final downside target in Wave C. He forecasts that the Bitcoin price could decline to the $51,336 to $35,564 range, representing a massive 55% to 69% decrease from the previous bounce area.
Notably, V has stated thatBitcoin’s projected move to its final bearish target could catch the majority of investors and traders completely off guard. This is because a relief rally back towards six figures in Wave B would likely restore investor confidence and draw buyers back in, only for the market to decline all over again to an even steeper target. In other words, it could be abull trap.
The Bitcoin End Game That Could Shock Investors
Following the anticipated completion of the Wave 2 correction, V predicts the onset of Wave 3, a phase that could trigger a powerfulbullish reversal for Bitcoin. The chart illustrates a projected rally, highlighted by a rising arrow. Bitcoin is expected to retest and reclaim its previous resistance level around $109,354, marking a potential gain of more than 207% from its projected Wave C bottom around $35,564.
Related Reading
Once BTC crosses this resistance with strong momentum, the chart projects a stronger upward push towarda shocking $150,000 target. Notably, the last time Bitcoin was remotely close to this level was in October 2025, when its price skyrocketed tonew all-time highs above $126,000. If the V’s Elliott Wave forecast plays out as expected, it would mark a new historic ATH for BTC.
BTC trading at $67,056 on the 1D chart | Source: BTCUSDT on Tradingview.com
Featured image from Getty Images, chart from Tradingview.com
]]>https://cryptocurrencypanther.com/2026/03/03/elliot-wave-theory-says-bitcoin-price-is-headed-to-40000-but-the-end-game-will-shock-you/feed/0Gold Is Overvalued, Rotation into Bitcoin Is Due: Will 80% BTC Crash Theory Hold?
https://cryptocurrencypanther.com/2025/12/16/gold-is-overvalued-rotation-into-bitcoin-is-due-will-80-btc-crash-theory-hold/
https://cryptocurrencypanther.com/2025/12/16/gold-is-overvalued-rotation-into-bitcoin-is-due-will-80-btc-crash-theory-hold/#respondTue, 16 Dec 2025 16:45:48 +0000https://cryptocurrencypanther.com/2025/12/16/gold-is-overvalued-rotation-into-bitcoin-is-due-will-80-btc-crash-theory-hold/
Key Notes
Bitcoin’s RSI against gold has dropped below 30 for only the fourth time.
The other 3 times, this scenario has been noticed near major BTC market bottoms.
Analyst Michael van de Poppe said that gold appears overvalued relative to BTC.
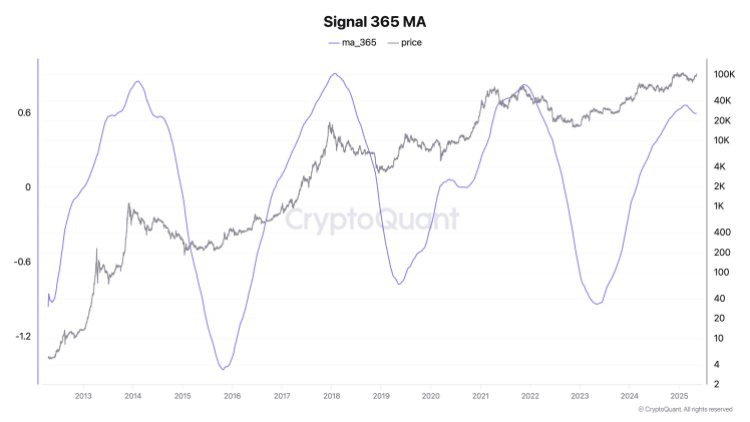
Market analyst Michael van de Poppe said Bitcoin is reaching a rare valuation level when compared with gold. According to his analysis, the relative strength index (RSI) of Bitcoin against gold has dropped below 30 for only the fourth time in Bitcoin’s history.
For the fourth time in the history of #Bitcoin, the RSI against Gold is hitting <30.
The previous three times this occurred: – Bottom in 2015 bear market. – Bottom in 2018 bear market. – Bottom in 2022 bear market.
market bottoms in 2015, 2018, and 2022. In each case, Bitcoin later began a long recovery phase. Van de Poppe said this does not guarantee a repeat, but it suggests a strong imbalance between the two assets.
He believes gold is currently overvalued relative to Bitcoin and that a rotation from gold into Bitcoin may be approaching. He also noted that the distance between Bitcoin and its 20-week moving average is unusually large, a condition that has usually resulted in recovery rallies.
Bitcoin Price Correction and Why It Happened
Poppe also discussed the recent price action in Bitcoin after a rejection at $90,000. After failing to hold support, Bitcoin moved lower alongside declines in gold and US equities such as the Nasdaq.
According to his analysis, a move back above $88,000 could boost optimistic sentiment among traders. If weakness continues, he is watching pullback levels below $83,800 and potentially below $80,500.
There we go.
Bounce back upwards, clear rejection at $90K and the support couldn’t hold as everything corrects; Gold, Nasdaq and #Bitcoin.
New low made, and therefore, a few important things to look at:
He admitted that trading is risky because of the current macro calendar, which includes US unemployment data, inflation data, and a widely expected interest rate hike from the Bank of Japan.
Bitcoin has historically reacted negatively after past rate hikes from Japan, van de Poppe cautioned investors.
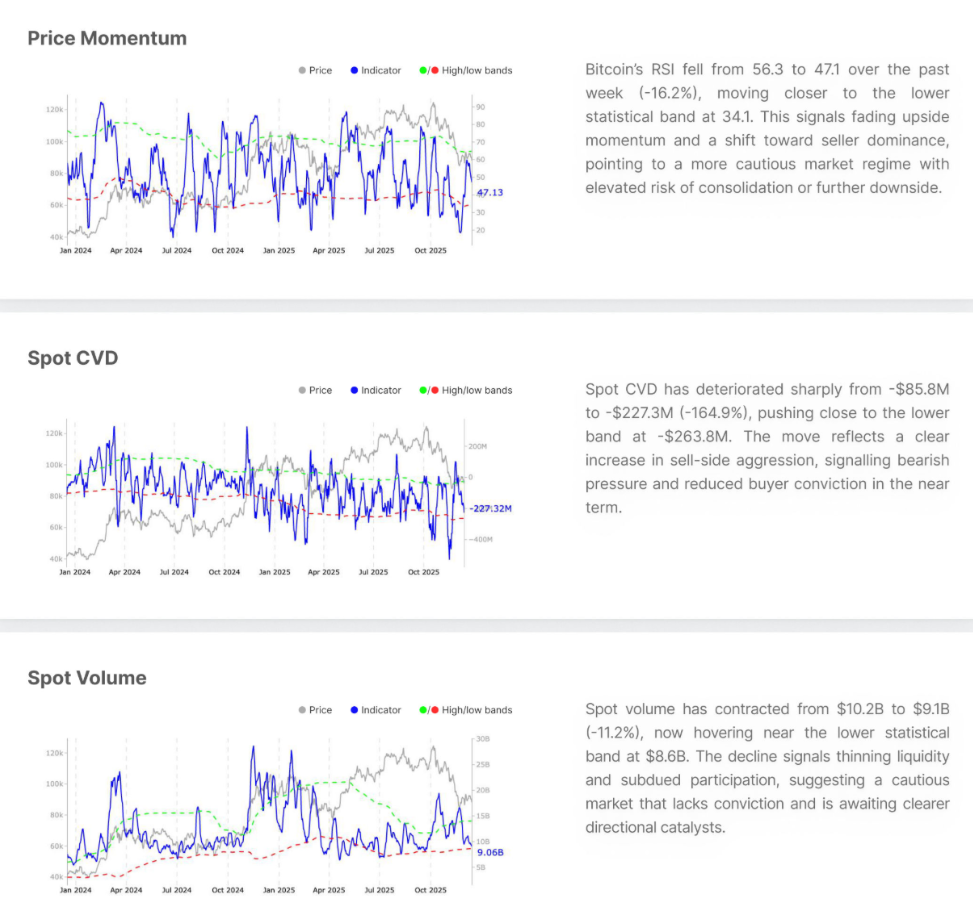
On the other hand, Glassnode said in its BTC Pulse report that the Bitcoin 14-day RSI has moved back toward neutral levels, while spot market conditions have worsened. Spot cumulative volume delta turned negative as well. Trading volume also fell toward a lower historical range while futures open interest declined slightly.
Bitcoin RSI, Spot CVD, and Spot Volume | Source: Glassnode
Glassnode added that long positions are still present but may be vulnerable if prices fall further.
80% Crash Risk
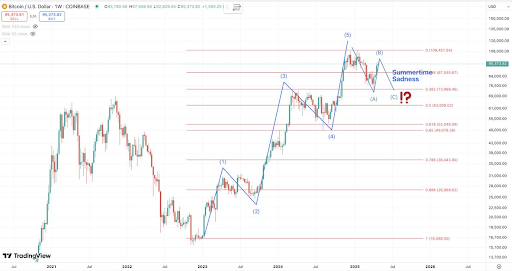
Veteran trader Peter Brandt warned that Bitcoin has broken its parabolic trendline. In past cycles, similar situations saw BTC prices drop as much as 80% from the peak.
Bitcoin investors, do you know:
1. Bull cycles have experienced exponential decay 2. BTC’s bull cycles have undergone parabolic advances 3. The violation of previous parabolas have all declined <80% 4. The current parabolic advance has been violated
Bitcoin is currently about 20% below its all-time high. If historical patterns were to repeat, an 80% decline would mean a drop to $25,000. Brandt noted that such moves usually occur during periods of tighter global financial conditions.
However, the current cycle differs from earlier ones. Data shows that Bitcoin ownership has become more institutional and long-term. Corporate Bitcoin holdings have grown from around 197,000 BTC in early 2023 to more than 1.08 million BTC today, an increase of roughly 448%.
According to Bitcoin researcher Axel Adler Jr., “Bitcoin is currently in a correction phase after three years of growth.” With BTC currently trading above $86,000, long-term investments from institutions may limit an 80% Bitcoin price crash.
As Bitcoin price movement remains uncertain, a new project, Bitcoin Hyper (HYPER) has entered the market. The project has already attracted strong attention during its presale stage, securing $29.52 million through its presale.
Bitcoin Hyper aims to tackle common limitations found on the Bitcoin network, including slower transaction processing, rising fees, and the absence of native smart contract support. The platform introduces a faster Layer 2 framework that handles transactions through an upgraded virtual machine.
However, the final settlement records are on the Bitcoin main chain. This structure maintains Bitcoin’s settlement security while allowing quicker and more efficient activity.
The HYPER token plays a key role in the Bitcoin Hyper network. It is used for gas fees, staking, and access to selected platform functions. These uses connect the token closely to daily network operations.
Currently, the presale price stands at $0.013435. According to the project’s official website, a price increase could occur within the next few hours. Interested investors can learn how to buy Bitcoin Hyper before this price surge event.
Disclaimer: Coinspeaker is committed to providing unbiased and transparent reporting. This article aims to deliver accurate and timely information but should not be taken as financial or investment advice. Since market conditions can change rapidly, we encourage you to verify information on your own and consult with a professional before making any decisions based on this content.
A crypto journalist with over 5 years of experience in the industry, Parth has worked with major media outlets in the crypto and finance world, gathering experience and expertise in the space after surviving bear and bull markets over the years. Parth is also an author of 4 self-published books.
Source link
]]>https://cryptocurrencypanther.com/2025/07/14/cardano-bitcoin-defi-vision-is-no-longer-theory-hoskinson-bitcoinist-com/feed/0Analyst Predicts XRP Price Will Reach $20-$30 — Elliott Wave Theory Holds The Key
https://cryptocurrencypanther.com/2025/07/07/analyst-predicts-xrp-price-will-reach-20-30-elliott-wave-theory-holds-the-key/
https://cryptocurrencypanther.com/2025/07/07/analyst-predicts-xrp-price-will-reach-20-30-elliott-wave-theory-holds-the-key/#respondMon, 07 Jul 2025 14:52:45 +0000https://cryptocurrencypanther.com/2025/07/07/analyst-predicts-xrp-price-will-reach-20-30-elliott-wave-theory-holds-the-key/
Crypto expert XForceGlobal has issued a new bullish forecast for the XRP price, predicting that the third-largest cryptocurrency is gearing up for its biggest rally yet. With the Elliott Wave Theory as the key indicator for this move, the analyst believes that XRP could soon see a potential surge between $20 and $30 this bull cycle.
XRP Price Forecasted To Rise To $27
In his video analysis posted on X social media, XForceGlobal predicted that XRP is on the cusp of an explosive breakout to $27. The market expert began his analysis by highlighting that XRP’s volatility has crashed to rock bottom, marking the first time in the cryptocurrency’s history that it has reached such levels.
Related Reading
Currently, the cryptocurrency is trading close to all-time highs and has been moving within a tight range between $1.5 and $3.8 for six months. XForceGlobal calls this trade range an “unprecedented price action,” which XRP has never experienced on the macro level.
XForceGlobal also noted that XRP’s persistent range-bound trading is likely due to investors refusing to sell off their tokens. He revealed that nearly all momentum indicators are aligning in favor of a move toward new all-time highs. More importantly, signals from the Elliott Wave Theory support that XRP may be on the verge of a powerful breakout soon.
Using this theory, XForceGlobal explains that XRP is currently entering Wave 3 after experiencing a five-wave move that triggered a surge from $0.37 to above $2.4, followed by a three-wave correction toward $1.5. The analyst explained that within the Elliott Wave Theory, Wave 3 is typically the strongest and longest wave. As a result, he predicts that the XRP price is likely going to hit an initial target around $16.3 soon, making it significantly more profitable than the historic December breakout, when the cryptocurrency surged from its long-held $0.5 range to above $2.
Following the completion of Wave 3, XForceGlobal predicts that XRP will possibly experience a crash toward $6 in Wave 4. After this correction, the cryptocurrency is expected to begin forming Wave 5, which is where its price is projected to skyrocket toward $27.
XRP Alternative Bullish Case
During his video analysis, XForceGlobal suggested that while XRP could potentially surge to between $20 and $30 in Wave 5, this outcome isn’t guaranteed. If it does not play out, the alternative scenario involves a much longer corrective phase within a flat structure. This is anticipated to be followed by a potential breakout above $4 in Wave 3 before a much powerful rally into the double-digit territory.
Related Reading
He predicts that once XRP climbs above $4, it could undergo a sharp correction down to $1.56, representing wave c of the five-wave impulse move. Notably, XForceGlobal admitted that it is still challenging to determine which of the two bullish scenarios is more likely to unfold at this time. However, the analyst emphasizes that regardless of which scenario unfolds, XRP will still be aiming for the upside and retesting the $4 level.
XRP trading at $2.29 on the 1D chart | Source: XRPUSDT on Tradingview.com
Featured image from Getty Images, chart from Tradingview.com
]]>https://cryptocurrencypanther.com/2025/07/07/analyst-predicts-xrp-price-will-reach-20-30-elliott-wave-theory-holds-the-key/feed/0CryptoQuant CEO Says It’s Time To Throw Out ‘Cycle Theory’
https://cryptocurrencypanther.com/2025/05/10/cryptoquant-ceo-says-its-time-to-throw-out-cycle-theory/
https://cryptocurrencypanther.com/2025/05/10/cryptoquant-ceo-says-its-time-to-throw-out-cycle-theory/#respondSat, 10 May 2025 09:54:46 +0000https://cryptocurrencypanther.com/2025/05/10/cryptoquant-ceo-says-its-time-to-throw-out-cycle-theory/
Reason to trust
Strict editorial policy that focuses on accuracy, relevance, and impartiality
Created by industry experts and meticulously reviewed
The highest standards in reporting and publishing
Strict editorial policy that focuses on accuracy, relevance, and impartiality
Morbi pretium leo et nisl aliquam mollis. Quisque arcu lorem, ultricies quis pellentesque nec, ullamcorper eu odio.
CryptoQuant Founder and CEO Ki Young Ju has walked back his bearish prediction after the Bitcoin price broke out above $100,000. This move has taken the entire market by surprise after calls for lower prices dominated the crypto space for the last few months. As sentiment has moved back into the positive, Young has turned bullish, explaining the change in his stance and what is going on with the market right now.
Bitcoin Bull Cycle Is Not Over
In an X post, CEO Ki Young Ju explained how the current market has deviated from the previous cycles. For one, he explains that the market is no longer reliant on old Bitcoin whales, retail investors, and miners to move the market. This used to be the way to know the cycle top, which was when old whales and miners were offloading their bags. However, the market has managed to move on, and the Bitcoin price is now better positioned to absorb large sell-offs without issue.
Related Reading
Young explains that this can be attributed to how diverse the market has become so far. The advent of Spot Bitcoin ETFs, which were approved by the Securities and Exchange Commission (SEC) back in 2024, have opened up new avenues for liquidity. Now, it is not only new retail investors playing the field, but also institutional investors who have been given an avenue to enter the market, and with much larger pockets.
This new and substantial flow of liquidity has made it so that even sell-offs from large whales are no longer impacting the Bitcoin price the way they used to. Thus, the CEO believes that it is time to actually shift focus from the old to the new.
Source: X
Given this change in the tide, the CryptoQuant CEO stated that it might be time to throw out the cycle theory. This is because of the changes in liquidity flow, as sources have become more uncertain. “Now, instead of worrying about old whales selling, it’s more important to focus on how much new liquidity is coming from institutions and ETFs since this new influx can outweigh even strong whale sell-offs,” Young explained.
Related Reading
Nevertheless, he still posits that the current market isn’t flashing a clear bearish or bullish pattern when it comes to the profit-taking cycle. As he explains, the market is still sluggish around absorbing all of the new liquidity coming from the different sources and indicators are still “hanging around the borderline.”
As for the Bitcoin price, it continues to show strength after crossing $100,000, as bulls eye new all-time highs above $109,000. Investor profitability has also skyrocket and a whopping 99% of all Bitcoin holders are now sitting in profit, according to data from IntoTheBlock.
]]>https://cryptocurrencypanther.com/2025/05/10/cryptoquant-ceo-says-its-time-to-throw-out-cycle-theory/feed/0Elliot Wave Theory Shows Where Bitcoin Is In This Cycle – Bull Rally Over?
https://cryptocurrencypanther.com/2025/05/06/elliot-wave-theory-shows-where-bitcoin-is-in-this-cycle-bull-rally-over/
https://cryptocurrencypanther.com/2025/05/06/elliot-wave-theory-shows-where-bitcoin-is-in-this-cycle-bull-rally-over/#respondTue, 06 May 2025 21:10:49 +0000https://cryptocurrencypanther.com/2025/05/06/elliot-wave-theory-shows-where-bitcoin-is-in-this-cycle-bull-rally-over/
Reason to trust
Strict editorial policy that focuses on accuracy, relevance, and impartiality
Created by industry experts and meticulously reviewed
The highest standards in reporting and publishing
Strict editorial policy that focuses on accuracy, relevance, and impartiality
Morbi pretium leo et nisl aliquam mollis. Quisque arcu lorem, ultricies quis pellentesque nec, ullamcorper eu odio.
Crypto analyst Tolimanu has used the Elliott Wave Theory to provide insights into where Bitcoin currently is in this market cycle. Based on his analysis, the bull run is not yet over, with the flagship crypto set to reach new highs.
Elliot Wave Theory Shows Bitcoin’s Current Position In This Cycle
In an X post, Tolimanu noted that in Elliot Wave Theory, a 5-wave move up typically marks a primary trend, and an ‘ABC’ correction is a natural retracement of that trend. Based on this, he stated that unless this Bitcoin correction breaks major long-term support levels, such a decline would typically set up the next higher-degree bullish phase.
Related Reading
On the bearish side, his accompanying chart showed that Bitcoin could still correct to as low as $73,969 on wave C of the ABC correction. However, as the analyst suggested, a hold above this support level could send BTC to new highs.
Technical expert Tony Severino also recently warned that the Bitcoin price is in a precarious position. Despite the recent surge, he suggested that BTC is still in a bearish position. The expert remarked that if the daily momentum crosses bearish, it could prevent the weekly bullish crossover and pull the weekly LMACD below zero.
In another post, Severino noted that Bitcoin’s daily RSI failed to get above 70, which is a key trigger required for a bullish impulse. He remarked that failure at 70 the last time led to the most vicious leg down of the last bear market. He added that the entire bear market remained below 70.
The technical expert also noted that in 2023, the two local tops did make it above 70, but it wasn’t convincing enough, while in 2024, the entire corrective phase stayed below 70 on the RSI. Basically, Severino highlighted the importance of 70 on the RSI and how BTC is still in a bearish position.
BTC Looking To Fill CME Gaps Below And Above
Crypto analyst Titan of Crypto revealed that Bitcoin is looking to CME futures gaps below and above its current price. The upside gap is between $96,480 and $97,300, while the downside gap is between $91,990 and $93,400. In another post, the analyst suggested that BTC might fill the downside gap before moving to the upside targets.
This came as he noted that the next key support for Bitcoin is the daily Fair Value Gap, which is around $90,000. The analyst added that a bounce from that zone is likely. His accompanying chart showed that the target on this bounce is $102,096.
At the time of writing, the Bitcoin price is trading at around $94,300, down in the last 24 hours, according to data from CoinMarketCap.
BTC trading at $94,316 on the 1D chart | Source: BTCUSDT on Tradingview.com
Featured image from Unsplash, chart from Tradingview.com
]]>https://cryptocurrencypanther.com/2025/05/06/elliot-wave-theory-shows-where-bitcoin-is-in-this-cycle-bull-rally-over/feed/0Dogecoin Could See Massive Price Rebound Anytime Soon as Analyst Highlights Dragonfly Doji and Mean Reversion Theory – The Crypto Basic
https://cryptocurrencypanther.com/2025/03/05/dogecoin-could-see-massive-price-rebound-anytime-soon-as-analyst-highlights-dragonfly-doji-and-mean-reversion-theory-the-crypto-basic/
https://cryptocurrencypanther.com/2025/03/05/dogecoin-could-see-massive-price-rebound-anytime-soon-as-analyst-highlights-dragonfly-doji-and-mean-reversion-theory-the-crypto-basic/#respondWed, 05 Mar 2025 12:40:50 +0000https://cryptocurrencypanther.com/2025/03/05/dogecoin-could-see-massive-price-rebound-anytime-soon-as-analyst-highlights-dragonfly-doji-and-mean-reversion-theory-the-crypto-basic/
Source link
]]>https://cryptocurrencypanther.com/2025/03/05/dogecoin-could-see-massive-price-rebound-anytime-soon-as-analyst-highlights-dragonfly-doji-and-mean-reversion-theory-the-crypto-basic/feed/0Is The Dogecoin Price To $10 Still Possible? 4-Year Cycle Theory Reveals The Answer | Bitcoinist.com – Bitcoinist
https://cryptocurrencypanther.com/2025/01/13/is-the-dogecoin-price-to-10-still-possible-4-year-cycle-theory-reveals-the-answer-bitcoinist-com-bitcoinist/
https://cryptocurrencypanther.com/2025/01/13/is-the-dogecoin-price-to-10-still-possible-4-year-cycle-theory-reveals-the-answer-bitcoinist-com-bitcoinist/#respondMon, 13 Jan 2025 17:43:49 +0000https://cryptocurrencypanther.com/2025/01/13/is-the-dogecoin-price-to-10-still-possible-4-year-cycle-theory-reveals-the-answer-bitcoinist-com-bitcoinist/
Source link
]]>https://cryptocurrencypanther.com/2025/01/13/is-the-dogecoin-price-to-10-still-possible-4-year-cycle-theory-reveals-the-answer-bitcoinist-com-bitcoinist/feed/0Elliot Wave Theory Suggests Bitcoin Price will Crash Below $40,000
https://cryptocurrencypanther.com/2024/07/31/elliot-wave-theory-suggests-bitcoin-price-will-crash-below-40000/
https://cryptocurrencypanther.com/2024/07/31/elliot-wave-theory-suggests-bitcoin-price-will-crash-below-40000/#respondWed, 31 Jul 2024 15:01:48 +0000https://cryptocurrencypanther.com/2024/07/31/elliot-wave-theory-suggests-bitcoin-price-will-crash-below-40000/
The Elliot Wave theory has become very popular among Bitcoin analysts, given its effectiveness in helping to estimate where the cryptocurrency’s price is headed next. Using this same theory, pseudonymous crypto analyst XForceGlobal has estimated what could happen next for the Bitcoin price.
Elliot Wave Theory Points To A Recovery
In the analysis posted on TradingView, XForceGlobal used the 5-wave Elliot Wave theory to predict further upside for the Bitcoin price. The chart maps out the waves and subwaves, all of which carry various implications for the Bitcoin price.
Related Reading
The crypto analyst points out that the subwaves are currently in play, ranging from 1-5. So far, subwaves 1 and 2 have finished their run, and with subwave 3, the analyst expects the price to continue to rise as this wave forms.
The Bitcoin price being caught in Wave 3 is actually good for the price from here, given that the third wave is known to be bullish. It is also a long wave, meaning that its effects will last longer than that of bearish wave 2, although shorter than Wave 1.
However, instead of just being a straight shot for the Bitcoin price, the crypto analyst warns that it could end up being an ABC wave, which is inherently bearish for price. In this case, the Bitcoin price would rise and then decline.
Bitcoin Targets Going Forward
As mentioned above, the Bitcoin price being caught in the subwave 3 is bullish, meaning the price could surge further from here. According to the crypto analyst’s chart, a 100% move from here is possible, putting the BTC price as high as $126,000.
However, the next wave, Subwave 4, is very bearish and the analyst predicts a major crash. They put the target as low as $39,728, which is an over 60% decline from the $126,976 price target from subwave 3, which would mark the most notable drawdown in the Bitcoin price since 2022.
Related Reading
The next wave, Subwave 5, is then expected to continue the bullish narrative, triggering an over 200% rise from the lows from subwave 4. It is expected to peak at around $153,000, marking the completion of the five subwaves.
Despite the bullish scenarios mapped out, the crypto analyst warns that “while the evidence strongly suggests that Bitcoin will reach higher levels before any significant correction, it is crucial to remain adaptable as market conditions evolve.”
They further added: “No theory can predict market movements with absolute certainty. By staying informed and considering multiple scenarios, investors can better navigate the complexities of the cryptocurrency market.”