Ethereum has reclaimed key price levels after a volatile weekend, emerging as one of the strongest performers in the ongoing market rebound. As Bitcoin stabilizes near $100K, altcoins are gaining momentum, with ETH once again leading the charge. The recovery comes amid renewed optimism across the crypto sector, as traders and investors position for potential upside following weeks of correction and fear-driven selling.
Related Reading
According to a CryptoQuant report by analyst Darkfost, Ethereum trading volume has reached record highs on Binance, highlighting the speculative nature of the current market. The report notes that speculation now plays a much larger role than in previous cycles, with trading activity at unprecedented levels.
In contrast to past bullish phases — when spot market activity dominated and provided a healthier foundation for growth — today’s rally appears heavily fueled by leverage and short-term speculation. This shift has made the market more volatile and less stable, even as prices recover.
Speculation Dominates as Ethereum Trading Activity Hits Unprecedented Levels
According to CryptoQuant analyst Darkfost, the Ethereum market is now driven by speculation more than ever before, as traders pursue quick returns rather than sustainable growth. This shift in behavior has created a far less stable trading environment, with volatility and leverage increasingly shaping price action.
Data shows that across centralized exchanges (CeX), both trading volumes and open interest have reached historic highs. On Binance, Ethereum trading volumes have already surpassed $6 trillion in 2025, roughly two to three times higher than in previous years.
Other major exchanges show similar patterns, but Binance continues to dominate market activity by a wide margin, underscoring its position as the primary venue for speculative ETH trading.

Open interest levels also tell a striking story. In August 2025, ETH open interest exceeded $12.5 billion on Binance — a staggering fivefold increase compared to the previous all-time high of $2.5 billion in November 2021. This explosion in leveraged positions highlights the extent to which Ethereum trading has evolved into a highly speculative environment dominated by short-term positioning.
Altogether, these trends reveal a market structure increasingly reliant on derivatives rather than spot buying. As Darkfost notes, this cycle’s speculative intensity makes Ethereum’s price dynamics far more fragile and reactive, explaining the frequent sharp swings and heightened sensitivity to liquidity shifts that now define the ETH market.
Related Reading
Testing Key Resistance After Sharp Sell-Off
Ethereum (ETH) is showing early signs of recovery following last week’s sharp decline, as the price rebounds from lows near $3,200 to trade around $3,590 at the time of writing. The rebound follows a strong reaction from buyers after multiple days of heavy selling pressure, hinting at renewed confidence in the market.

From a technical perspective, ETH’s recent bounce suggests that short-term momentum may be shifting back toward the bulls. The daily chart shows a clear structure of higher lows forming, but Ethereum still faces immediate resistance near the $3,650–$3,700 zone, which aligns with the previous consolidation area before the breakdown. A decisive close above this level could open the door for a move toward $3,850–$3,900, while failure to break higher may signal continued consolidation.
Related Reading
Volume analysis also shows that the recent bounce was accompanied by increased buying activity, reinforcing that the $3,200 region acted as a strong demand zone. However, overall trading conditions remain fragile, with volatility still elevated and speculative activity dominating the market.
Featured image from ChatGPT, chart from TradingView.com
Bitcoin News Today: ADA’s ETF Drama Unfolds as Investors Stake Their Bets AInvest
Source link ]]>
A new analysis by popular crypto chartist EGRAG CRYPTO on the social media platform X provides an in-depth look at five technical markets on XRP’s path forward. Notably, XRP’s price action has been experiencing a slight retracement and consolidation in early August following a rally in July during which XRP broke above $3 and reached new all-time highs.
Key Things To Watch Out For With XRP’s Price Action
Currently trading just around the $3.00 psychological level, XRP’s price action is witnessing volatile candles across shorter timeframes. However, according to the technical outlook from EGRAG CRYPTO, XRP bulls appear to be defending key zones around $2.90, amidst the broader market sentiment remaining cautiously optimistic.
Related Reading
The first key thing to watch out for is bullish closings above $3. Zooming into the 4-hour timeframe, EGRAG’s first key observation is that XRP has managed to close multiple candlesticks above the $3.00 threshold. This level is not only psychological but also a strong confidence booster for traders looking for confirmation of bullish continuation.
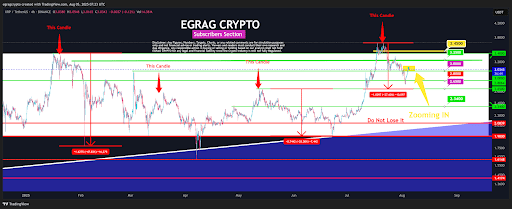
Secondly, the charts show that most of the candle wicks are forming from the upside, a sign that while sellers are active, they have not overwhelmed the buying strength just yet.
However, the third key thing to watch out for is a possible correction. Particularly, EGRAG noted that a retest of the $2.96 to $2.93 price zone is possible in the near term. This price range has been marked as a short-term support zone, where buyers could look to reload if XRP briefly dips.
That being said, the more critical level for bulls to protect is $2.80, which is the fourth key thing to watch out for. According to the analyst, closing below $2.80 again would undermine the bullish structure and could cause downside momentum. As such, holding above this level is crucial for maintaining bullish momentum.
Price Target Goals
The fifth key thing to watch out for as the bull market unfolds is price targets that can confirm bullish momentum. In terms of price targets and resistances, EGRAG noted specific price levels that would reflect new bullish energy and possibly a breakout to new all-time highs.
Related Reading
The first milestone is a close above $3.185. This level previously acted as a rejection zone in late July. Therefore, breaching $3.185 with conviction would flip sentiment more decisively in favor of the bulls. Above that, the analyst highlighted $3.25 as the next key checkpoint, and surpassing it would put XRP in a strong technical position.
The resistance targets beyond that are $3.33 and $3.45, and these are breakout zones that could cause a new all-time high scenario. These targets align with the upper resistance blocks illustrated on EGRAG’s charts, and any solid close above $3.45 can be interpreted as a move to at least $3.65.
At the time of writing, XRP is trading at $3, up by 2.4% in the past 24 hours.
Featured image from iStock, chart from Tradingview.com
Cardano and XRP Drama Unfolds, Paving The Way For This New Crypto Superstar Predicted To 100x In 2025 TronWeekly
Source link ]]>
Arctic Pablo Surpasses $2M — Early Investors Could See 9552% ROI as Crystal Cove Phase Unfolds, While SPX6900 and Shiba Inu Gain Momentum Analytics Insight
Source link ]]>
Dogecoin Price Path To $5 Unfolds, Key Bullish Patterns Spotted The Coin Republic
Source link ]]>
Cardano Price at War as ADA ETF Drama Unfolds: Crypto Analyst Crypto Times
Source link ]]>
New Highs Coming for Dogecoin (DOGE): 3 Meme Coins to Watch as Crypto’s Dog Season Unfolds CryptoDaily
Source link ]]>
Crypto Experts Say XRP Holders Are Exploring RBLK and ADA While The Ripple vs SEC Appeal Drama Unfolds | Bitcoinist
Source link ]]>
Dogecoin and Mpeppe: Evolution in Memecoin Investments Unfolds West Island Blog
Source link ]]>