Experts Name BlockDAG Network the Best Altcoin Choice for 2024’s Bull Run Amid Uptrends for Solana and Cardano BSC NEWS
Source link ]]>
Cardano: Of uptrends, volume dynamics, and bullish bets AMBCrypto News
Source link ]]>
A quant has explained how a specific Bitcoin funding rates pattern has preceded uptrends in the asset’s price during recent months.
The Bitcoin 72-Hour MA Funding Rates Pattern That May Kick Off Uptrends
As explained by an analyst in a CryptoQuant post, the price has started rising recently whenever the metric has been near zero inside the negative zone. The “funding rate” is an indicator that measures the periodic fee that traders on the Bitcoin futures market are currently exchanging with each other.
When the value of this metric is negative, it means the short contract holders are currently paying a premium to the long holders in order to hold onto their positions. Such a trend suggests that bearish sentiment is more dominant in the market right now.
On the other hand, positive values of the indicator imply the longs are paying a fee to the shorts at the moment, and hence, the holders with a bullish mentality outweigh those with a bearish one.
Now, here is a chart that shows the trend in the 72-hour moving average (MA) Bitcoin funding rate over the last few months:

Looks like the 72-hour MA value of the metric has been positive in recent days | Source: CryptoQuant
As you can see in the above graph, the quant has marked the relevant portions of the trend for the 72-hour MA Bitcoin funding rates. It seems like there have been a few instances during the last few months where the indicator has just turned negative (that is, still near the zero mark) and the price of the cryptocurrency has followed up by catching some upwards momentum shortly after.
While the left and right instances in the chart had the metric coming back inside the positive zone not too long after forming this pattern, the middle occurrence saw it go much deeper inside the negative territory first, and it was only after the initial leg up in the price that the funding rate became positive again.
Based on this, it seems like a neutral to a negative value of the 72-hour MA Bitcoin funding has provided the proper ground for the price to rally during these last few months.
Recently, the indicator has had positive values, implying that the total number of long positions has been overwhelming that of the short positions. Though, in the last few days, the metric has been gradually going down.
Despite this drawdown, however, the 72-hour Bitcoin funding rate is still significantly above the zero line, meaning that if the pattern that has apparently held during the last few months has to form again, more bearish positions would need to be opened on the market to nudge the balance towards the negative zone.
BTC Price
At the time of writing, Bitcoin is trading around $28,600, down 6% in the last week.
The value of the asset seems to have sharply gone down in recent days | Source: BTCUSD on TradingView
Featured image from Kanchanara on Unsplash.com, charts from TradingView.com, CryptoQuant.com
A top crypto strategist is predicting sustained uptrends for a handful of altcoins including Cardano (ADA) and Chainlink (LINK).
Michaël van de Poppe tells his 621,500 Twitter followers that smart contract platform Cardano appears to be gearing up for a fresh rally to the upside.
“Looking for continuation as it has been testing the resistance zone many times. Breaking $0.55 would trigger continuation towards $0.67 and that flip would grant a trigger for long entries as well.”
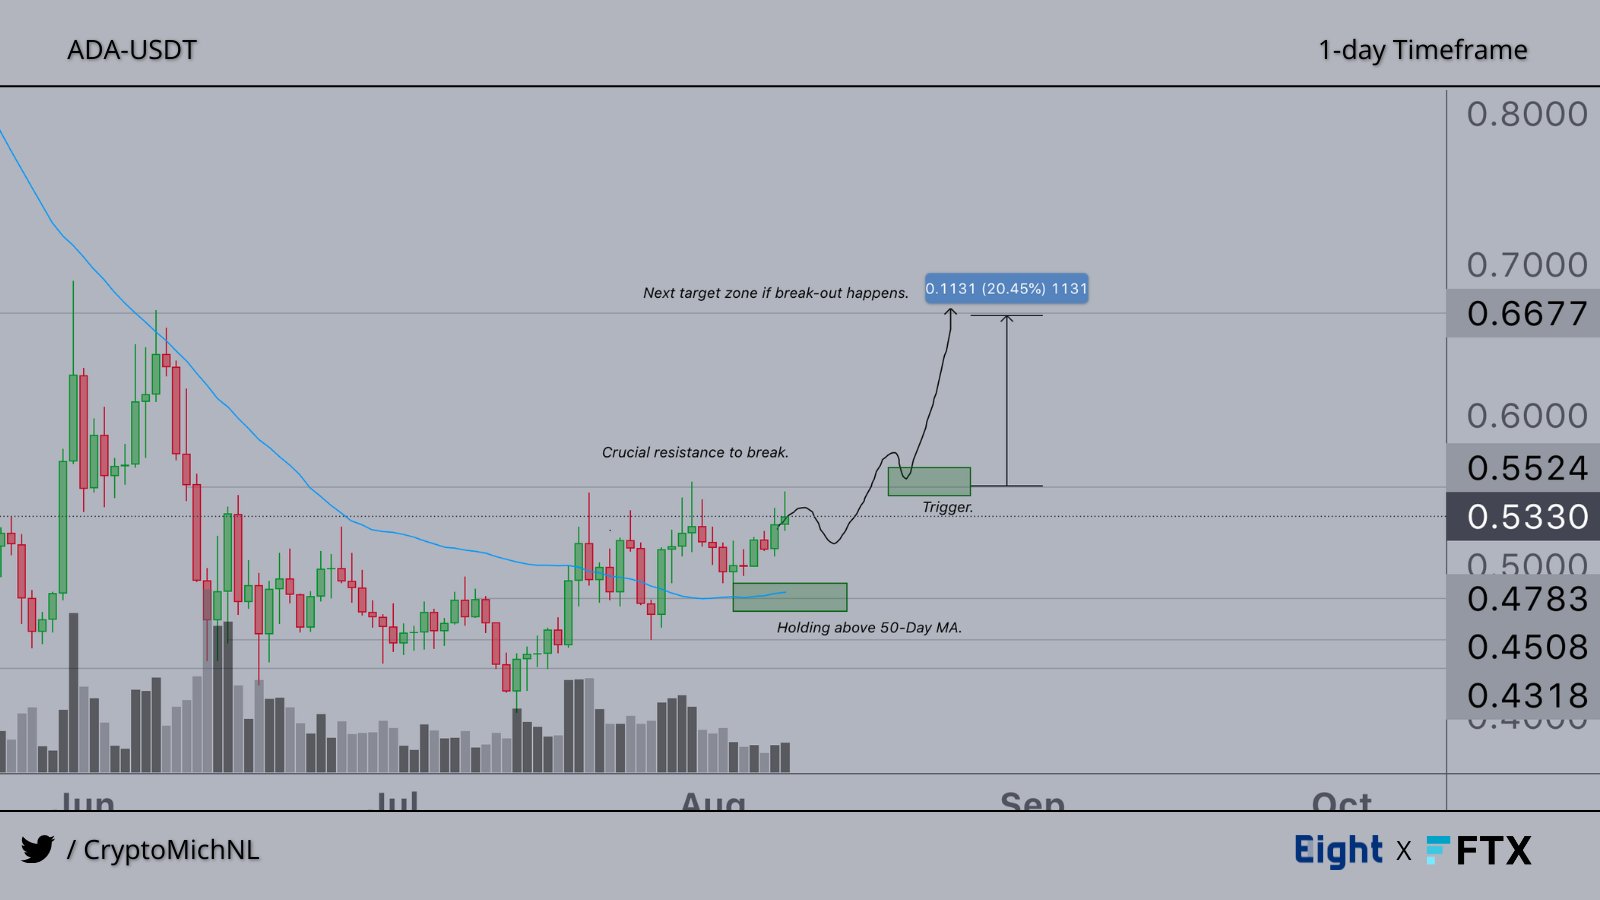
At time of writing, ADA is swapping hands for $0.50, down 4.65% on the day.
Next up is decentralized oracle network Chainlink. Van de Poppe says he sees LINK correcting to around $8 before it could ignite a new leg up.
“This one is trending upwards.
Looking like a flip of $8 can grant continuation towards $12-$12.50.
Still an opportunity of a lifetime with current prices. Medium target could be $13.50-15.00. Must-hold range is $7.50-$8.00.”
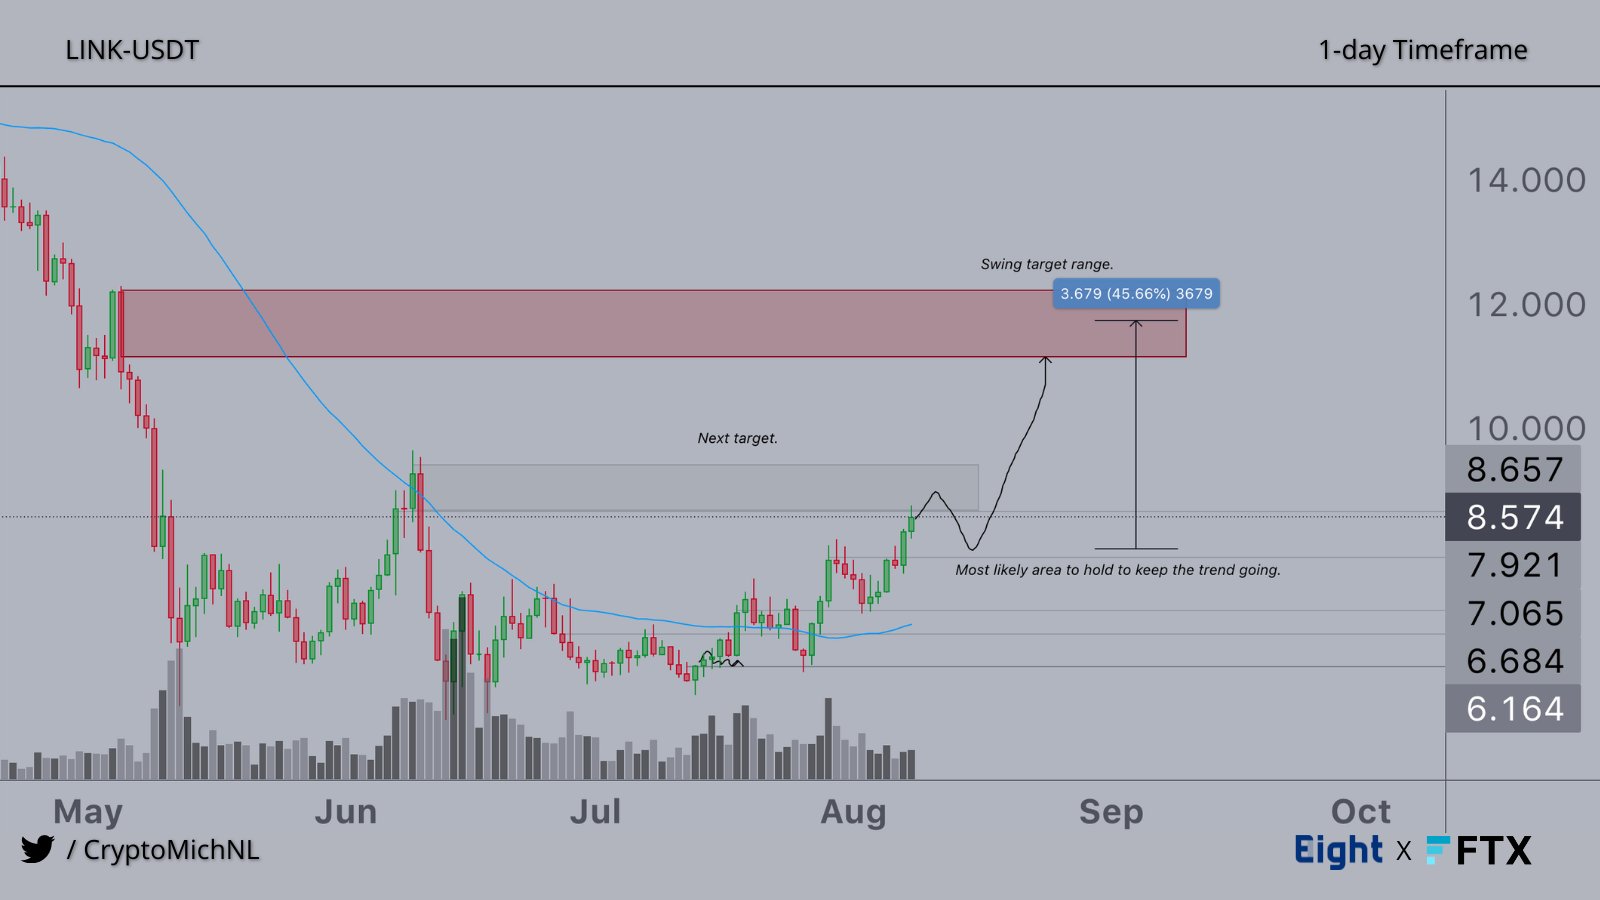
At time of writing, LINK is trading at $8.46, a nearly 4% decrease on the day.
Another altcoin on the trader’s radar is smart contract protocol Fantom (FTM). According to Van de Poppe, FTM could explode as long as it stays above a crucial support level.
“Looking strong and trending upwards. I’m still in my longs and have been trading in between… Expecting continuation towards $0.45 and $0.50 if $0.34 holds.”
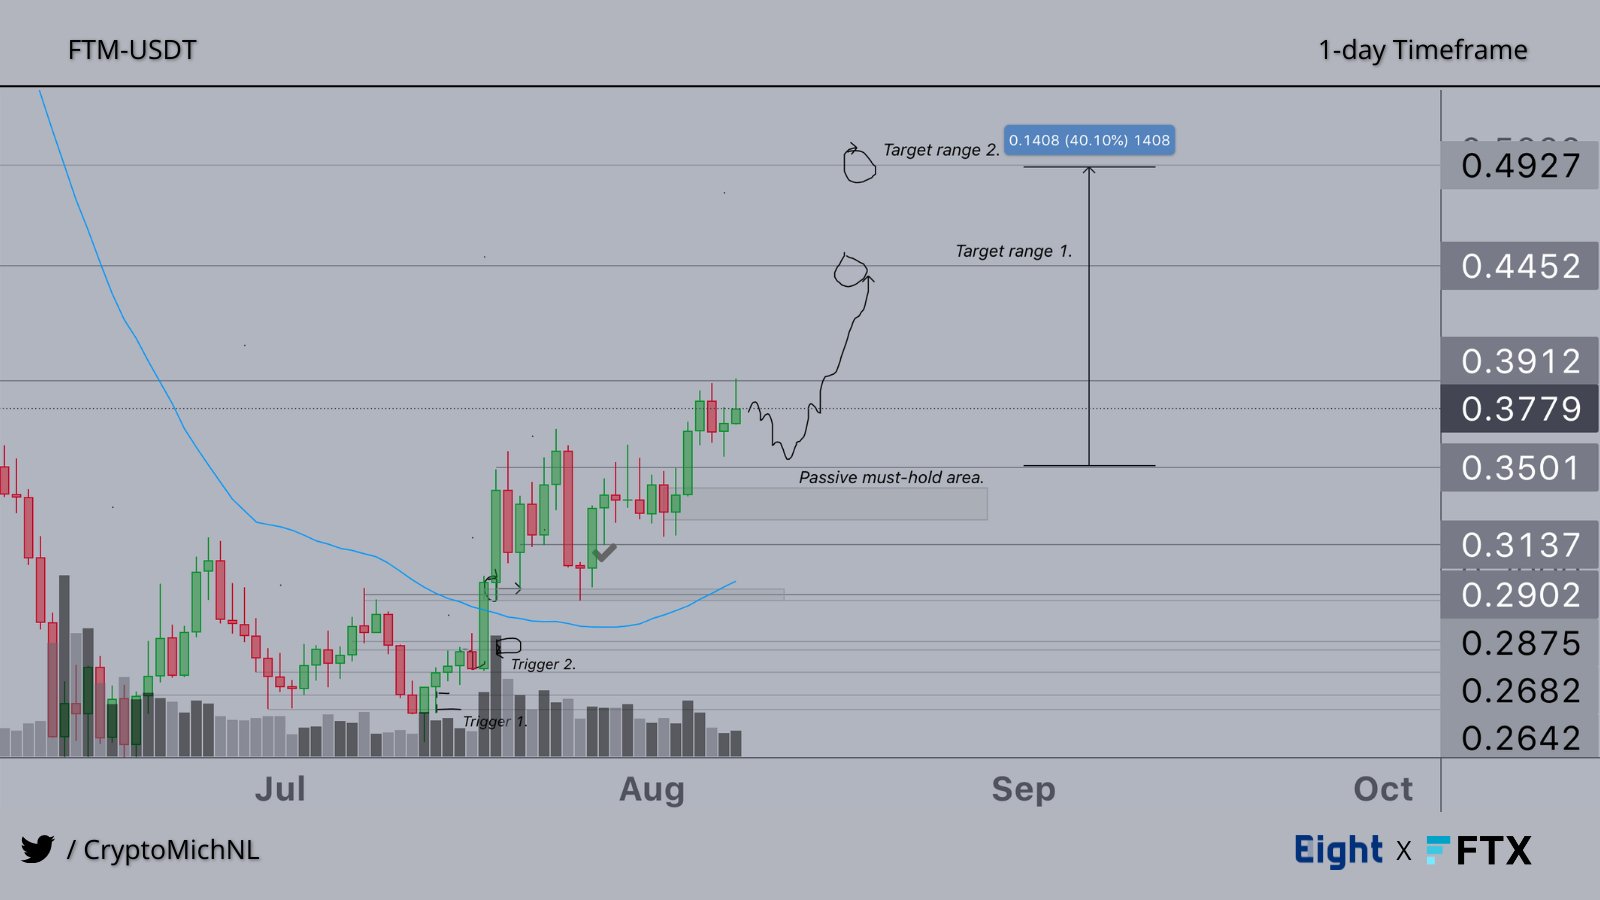
At time of writing, FTM is changing hands for $0.36, down over 5% in the past 24 hours.
The last coin is Quant (QNT), a protocol that aims to enable multiple blockchains to interact seamlessly. Van de Poppe says QNT is in a strong uptrend and he’s waiting for a dip to $110.
“Showing strength, and that’s good… $140 area is resistance. $110 [is] area [for] potential long entries.”
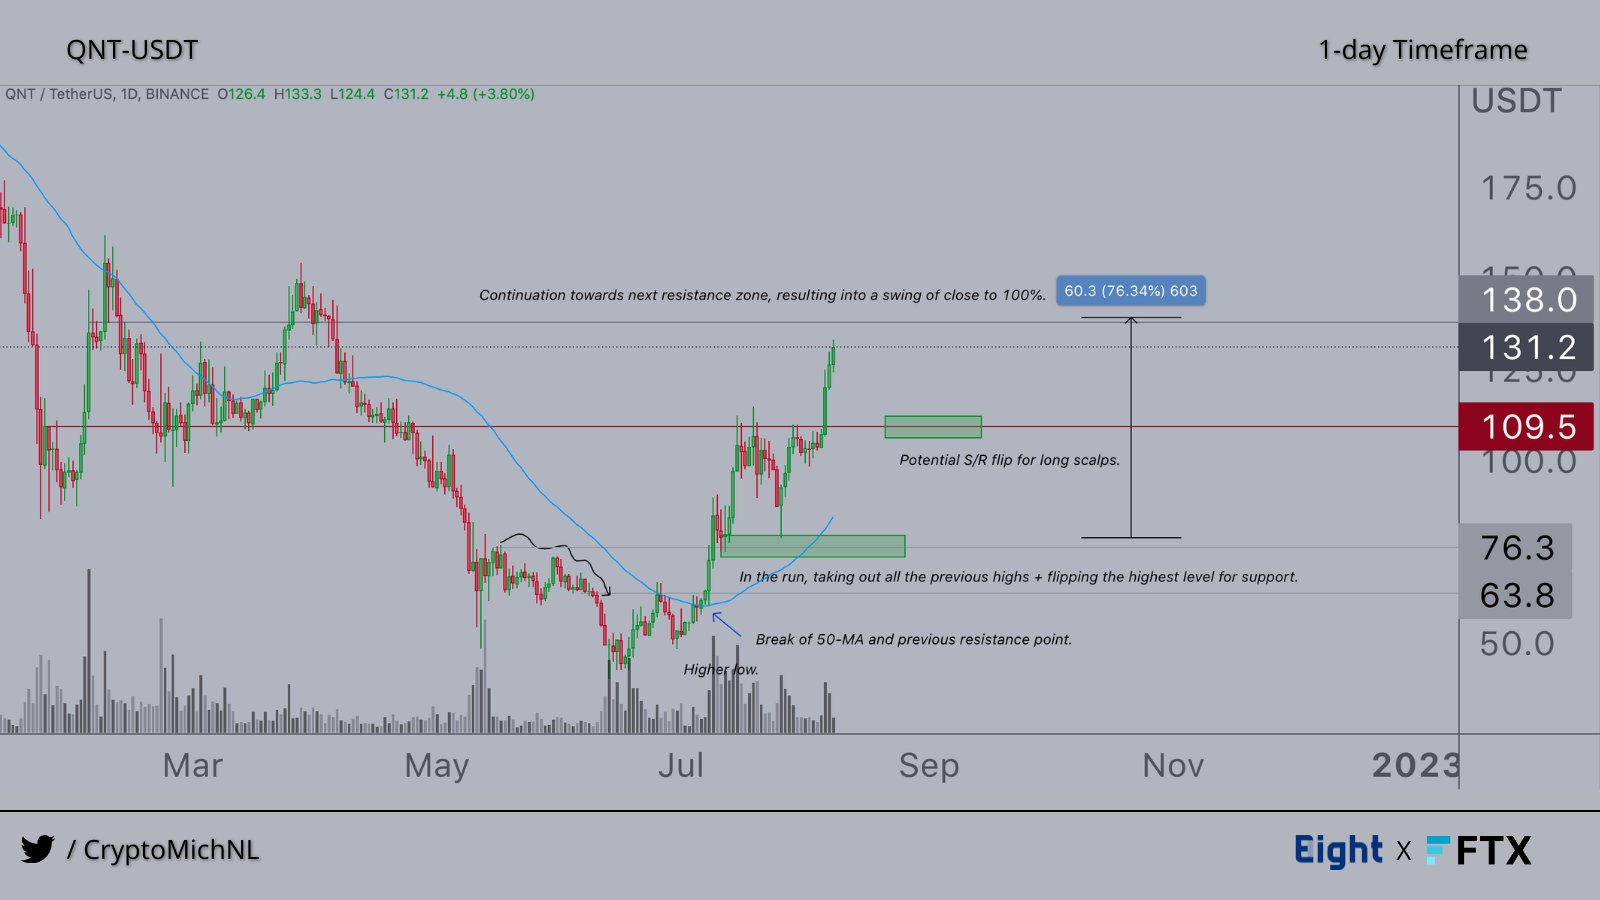
At time of writing, QNT is valued at $122.74, down 2.74% in the last day.
Don’t Miss a Beat – Subscribe to get crypto email alerts delivered directly to your inbox
Check Price Action
Follow us on Twitter, Facebook and Telegram
Surf The Daily Hodl Mix
 

Disclaimer: Opinions expressed at The Daily Hodl are not investment advice. Investors should do their due diligence before making any high-risk investments in Bitcoin, cryptocurrency or digital assets. Please be advised that your transfers and trades are at your own risk, and any loses you may incur are your responsibility. The Daily Hodl does not recommend the buying or selling of any cryptocurrencies or digital assets, nor is The Daily Hodl an investment advisor. Please note that The Daily Hodl participates in affiliate marketing.
Featured Image: Shutterstock/d3verro
The boosted rally that was recorded in the digital currency ecosystem in the previous week may become a source of a huge upshoot in the coming week. This speculation is being held dear by many crypto proponents on various social media platforms, as the rally that pushed the top coins may begin to materialize in the coming week. Based on current fundamentals and ecosystem activities, here are the top two coins to watch out for this week.
Bitcoin (BTC)
Bitcoin single-handedly drove the broad cryptocurrency market cap to new heights in the previous week. The coin surged by more than 10.30% in the trailing 7 days, surging to a weekly high of $62,757.13, and its highest level since April.

While the Bitcoin price surge was based on steady growth through the course of October, the past week’s growth was heightened by sentiment surrounding the approval of ProShares Bitcoin Futures Exchange Traded Fund (ETF) by the Securities and Exchange Commission (SEC).
All seems set per various media reports citing people familiar with the SEC matters, and we may begin to see the Bitcoin Futures ETF product start trading from next week on NYSE Arca, and under the ticker symbol BITO. Should this event pull through as projected, a new flood of institutional money may be ushered into the industry, as many conservative and regulatory-conscious investors will now have an avenue to gain exposure to the space.
Bitcoin is currently trading at $60,863.47 per data from CoinMarketCap, this price may receive a huge lift-off when institutional money starts flowing into the ProShares ETF product from next week. With the potential growth incoming, Bitcoin may retest its previous all-time high of $64,863.10 if the ETF product goes live as planned.
Polkadot (DOT)
Polkadot started off the previous week on a bearish note, but soon picked up the pace and charted a new weekly high of $44.68, a price point that is slightly shy of the ATH of $49.69, attained back in May.

The price facelift of the digital currency was fueled as Polkadot governing council passes the motion for open parachain auctions which if passed by the public will kick-off by next month. The DOT token has a lot to gain as it will find a central utility amongst protocols that will be bidding on the auctions, and the broad ecosystem activities can make the digital currency surpass its previous ATH, accompanied by a new price discovery.
Polkadot is changing hands at $41.25 and is up 16.85% for the week.
Disclaimer
The presented content may include the personal opinion of the author and is subject to market condition. Do your market research before investing in cryptocurrencies. The author or the publication does not hold any responsibility for your personal financial loss.
About Author