Reason to trust
![]()
Strict editorial policy that focuses on accuracy, relevance, and impartiality
Created by industry experts and meticulously reviewed
The highest standards in reporting and publishing
Strict editorial policy that focuses on accuracy, relevance, and impartiality
Morbi pretium leo et nisl aliquam mollis. Quisque arcu lorem, ultricies quis pellentesque nec, ullamcorper eu odio.
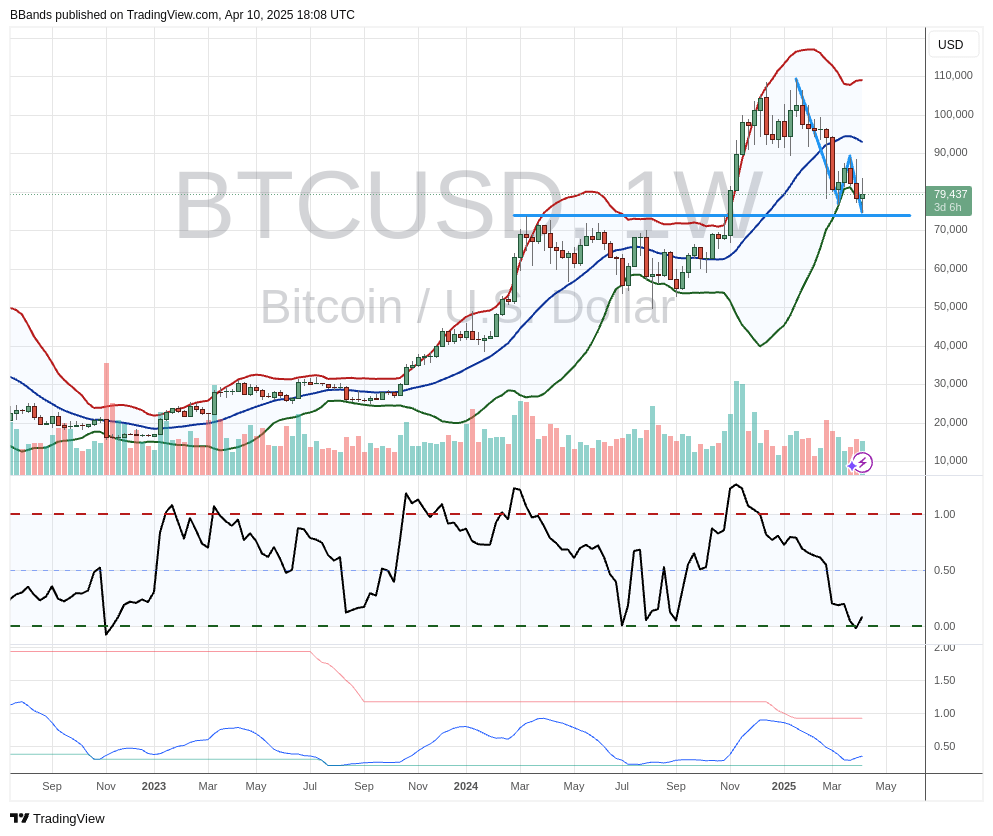
Legendary technical analyst John Bollinger has highlighted what he calls a “classic Bollinger Band W bottom” that may be forming on the Bitcoin pair BTC/USD. According to him, BTC appears to have found support in the $74,000 area, setting up the characteristic double-dip lows that define a W-shaped reversal pattern. Notably, Bollinger stressed that the setup still needs to be confirmed: “Classic Bollinger Band W bottom setup in BTCUSD. Still needs confirmation”.
Is The Bitcoin Bottom In?
The chart shows Bitcoin navigating a decline from its mid-January high near $110,000, with recent price action clustered around the lower band of the Bollinger Bands. The upper band sits at $108,837, while the lower band sits at $77,138, suggesting a relatively wide range of volatility on a weekly basis. The Bollinger’s mid-line is close to $93,000.
Related Reading
Bollinger’s indication of a W-bottom is based on the formation of two distinct troughs in quick succession, as seen in both the price data and the oscillator readings below the chart. The first trough materialised as BTCUSD fell from its then high of around $90,000 to the mid-$76,000 area, then rallied before sliding back to a comparable support area around $74,500. The repeated dip into this horizontal support level has so far held, which Bollinger identifies as a potential base for a bullish reversal – although he cautions that a definitive move above the intervening swing high near $90,000 would help validate this classic chart pattern.
Other market clues include slightly lower trading volumes, suggesting that the intense selling that drove bitcoin down from its recent peak may be easing. The chart’s momentum oscillator, which tracks overbought and oversold conditions, supports this thesis, forming a bottom near its lower border. Although this alignment with price action suggests a possible bottom, many technical analysts are looking for the oscillator to rise convincingly above its midpoint to confirm that momentum has indeed shifted in favour of buyers.
Related Reading
Bollinger bands themselves, invented by John Bollinger, measure volatility by placing envelope lines above and below a moving average. When these bands widen, the market typically experiences large price swings; when they narrow, volatility decreases. In Bitcoin’s case, they’ve remained relatively wide, reflecting the cryptocurrency’s dramatic range from below $20,000 to six figures over the past two years.
While talk of a W-bottom has sparked optimism among bullish traders, Bollinger’s reminder that it “still needs to be confirmed” highlights the importance of solid follow-through in price action. If Bitcoin can break above $90,000 on robust volume, the long-awaited confirmation of this pattern would be within reach. Until then, the W-bottom is just a possibility.
At press time, BTC traded at $81,366.
Featured image created with DALL.E, chart from TradingView.com
According to a chief market strategist, Ethereum could form a possible w-bottom, an indicator that usually suggests a bull market.
Strategist: Ethereum Might Form A “Higher High”
In a call with MarketWatch, Matt Maley has said that ETH could be moving in a bullish direction if certain conditions are met.
Maley is a chief market strategist at Tabak and Co., and during the call with MarketWatch, the strategist has talked about Bitcoin and Ethereum.
According to Maley, the 200 Daily Moving Average (DMA) is an important level, breaking above which would be bullish for the crypto. At the moment, this value is around $2,141, something ETH has already broken.
Ethereum could then go on to break $2,880, the same value as the high from late May-early June, to form an indicator called the “higher high”. The crypto has already formed “double bottoms” and a minor higher high.
ETH only needs to form a more important higher high now. According to Maley, something like this would be “particularly bullish” for the cryptocurrency.
However, one thing to note is that ETH is somewhat overbought right now, based on the Relative Strength Index, which is an indicator that measures the ratio of the recent losses to recent gains.
Related Reading | TA: Ethereum (ETH) Outpaces Bitcoin, Why Bulls Aim Larger Increase
When ETH is said to be overbought, it means the cryptocurrency is believed to be trading above its fair value. Investors “overbuy” without any investment rationale, and the price goes up. Usually, a phase of overbought is followed by a selling period.
ETH Price
At the time of writing ETH’s price floats around $2.6k, up 12% in the last 7 days. Over the past month, the cryptocurrency has amassed 19% in gains.
Below is a chart that shows the trend in the price of Ethereum over the last 6 months.

ETH continues to enjoy the upwards trend | Source: ETHUSD on TradingView
As the graph shows, the crypto has been on an uptrend since 20 July. On a closer examination of the graph, it becomes apparent that the coin seems to be forming a “W” where the first peak was the earlier mentioned $2,880 point, with the first bottom following soon after in the third part of June.
Related Reading | Ethereum Breaks 200,000 Validators Milestone, Over $14 Billion Now Staked In ETH 2.0
After that, ETH forms a smaller peak early July, and another bottom on the aforementioned 20 July. Now, if ETH continues to follow the uptrend, it will return to the point of the first peak. This is the important “higher high” that’s needed for a bullish trend.
However, it’s unclear whether Ethereum can break that level as the crypto is slightly overbought right now. The price could go down if investors decide to sell before the higher high is made.