The XRP price might be trading in a bearish mood, but exchange-held supply behind the scenes points to a trend that could matter for price direction in the months ahead. A recent report from 21Shares shows that exchange reserves have dropped to a seven-year low of 1.7 billion XRP. The report shows how tightening liquidity, ETF demand, and investor behavior are quietly lining up for a possible repricing for XRP in 2026.
Falling XRP Exchange Supply Meets ETF Demand
According to 21Shares, three pillars will shape XRP’s price action in 2026: regulatory clarity, substantial investor demand through spot ETFs, and real-world adoption of XRPL. As noted in a report by the Switzerland-based financial services company, exchange reserves are at roughly 1.7 billion XRP, their lowest level in over seven years.
Related Reading
This number coincides with an institutional demand in XRP ETFs, which is intersecting with a community that is increasingly adopting the outlook of holding. This narrowing of readily tradable supply is a catalyst for nonlinear repricing if sustained through the year. According to 21Shares, this is creating a supply-shock mechanism that mirrors the GameStop revolution on Reddit.
ETF products in the US have attracted over $1.3 billion in their first month with a record streak of consecutive inflows regardless of market conditions and outflows from other crypto ETFs. That persistent demand indicates, in the report’s view, a transition from speculative trading to structural capital allocation. This demand is still strong, although the cumulative total net inflow of these ETFs has since dropped to $1.18 billion at the time of writing.
The report also looked at the path set by Bitcoin spot ETFs as an analog, where nearly $38 billion of net inflows helped double Bitcoin’s price from $40,000 to $100,000 in under a year. Keeping this precedent in mind, XRP’s much smaller market capitalization at ETF launch, roughly one-eighth of Bitcoin’s, means that its inflows are going to exert a proportionally larger impact on price discovery. According to 21Shares, capital velocity on XRP could be higher, which is expected to amplify the reflexive price feedback loop if inflows continue.

XRP ETF Assets. Source: 21shares
XRP Price Outlook For 2026
The 21Shares report envisioned 2026 as a year where XRP’s valuation will be impacted by a combination of regulatory access, sustained ETF flows, and significant RWA volume on the XRP Ledger. In terms of pricing, it lays out a scenario range for 2026 that centers on a base case peak of $2.45 (assigned 50% probability), a bull case peak of $2.69 (30%), and a bear case peak of $1.60.
Related Reading
The base case assumes regulatory stability supports steady ETF inflows and gradual improvement in real-world utility, while the bull case leans on institutional-scale tokenization and tighter liquid supply creating a stronger repricing effect. The bear case, on the other hand, is tied to stagnant adoption and capital rotation away from XRP. Right now, XRP is trading around this bear case, and bulls are struggling to hold above $1.6.
Featured image created with Dall.E, chart from Tradingview.com
Yellow metal Gold has been dominating the market conversation, outperforming Bitcoin price performance, & S&P 500 so far in 2025. Banking giant Goldman Sachs made a bold prediction that the Gold price could rally to $5,000 if the Federal Reserve’s credibility goes for a toss. Furthermore, the loss of strength for the US Dollar, could
The post Where’s Bitcoin Price Heading If Gold Hits $5000 As Per Goldman Sachs? appeared first on CoinGape.
]]>Shiba Inu & Uniswap Hold Their Levels While Unstaked’s 0.011065 Token Sets Sights on $5: Where’s the Biggest ROI? MSN
Source link ]]>
Where’s Next Major Dogecoin Resistance? On-Chain Data Points To This TradingView
Source link ]]>
Reason to trust
![]()
Strict editorial policy that focuses on accuracy, relevance, and impartiality
Created by industry experts and meticulously reviewed
The highest standards in reporting and publishing
Strict editorial policy that focuses on accuracy, relevance, and impartiality
Morbi pretium leo et nisl aliquam mollis. Quisque arcu lorem, ultricies quis pellentesque nec, ullamcorper eu odio.
The Bitcoin price has just printed a major bullish signal, officially confirming a strong local bottom and sparking renewed sentiment among analysts. This bullish shift comes after April closed in the green, reclaiming technical levels and signaling the potential for a significant move toward the six-figure price territory.
Market expert Titan Of Crypto has announced on X (formerly Twitter) that Bitcoin has officially hit a local bottom. The analyst shared a chart showcasing that Bitcoin is flashing one of the strongest bullish signals.
Bitcoin Price Establishes Solid Local Bottom
A close above the Tenkan signals short-term bullish momentum, while the Kijun confirms strength in a medium-trend. The thick Kimo cloud represents the most bullish configuration, indicating clear trend dominance. Furthermore, when Bitcoin closes above all Ichimoku lines, it establishes a dynamic support or resistance zone, validating the overall bullish structure.
Adding more weight to this bullish signal, Titan of Crypto revealed that Bitcoin has reclaimed the April high, a key resistance level of around $95,173, which is now acting as a support area. The rectangular zone highlighted as “the local bottom” on the chart reflects price action between February and April 2025, where BTC formed a higher low above the Kijun. The bullish April monthly candle close above this zone officially establishes this region as a strong foundational support, which validates the possibility of a local bottom from a technical standpoint.
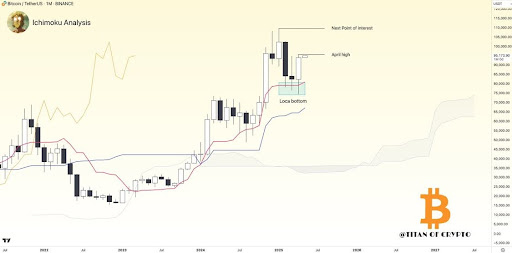
With the local bottom confirmed and momentum on its side, Bitcoin could be headed to the next likely resistance area, marked on the chart as the “Next Point of Interest.” This area sits above the $110,000 region, near $115,000.
For this bullish scenario to play out, BTC must maintain its position above the April high and the Kijun as dynamic support. Bulls will need to defend any retracements toward these zones to preserve momentum. Failure to do so could lead to a deeper correction, effectively invalidating the bullish outlook.
BTC Price Action Looks Strong
In a more recent X post, Titan of Crypto announced that Bitcoin is breaking out of a tight range and its price action looks strong. He shared an Ichimoku Cloud analysis of the cryptocurrency, showing a potential bullish breakout setup on the 1-day timeframe.
Related Reading
Looking at the price chart, Bitcoin has been consolidating between $92,880 and $95,800 over the past several days, but momentum appears to be building for a potential breakout. A confirmed close above $95,800 would validate the breakout and open the door for a bullish continuation, with the price target set near $99,000.
Featured image from Unsplash, chart from Tradingview.com
Cardano Price Can See Major Volatility, Where’s ADA Moving Next? Coinspeaker
Source link ]]>
‘Where’s The Scam?’ Cardano Founder Slams Critics Bitcoinist
Source link ]]>
Shiba Inu Network Shibarium Sees 98% Drop in Activity; Where’s All the Action Happening in 2025? Blockchain Magazine
Source link ]]>
XRP price started a consolidation phase from the $3.20 resistance zone. The price is now consolidating gains and might aim for more gains above the $3.20 zone.
- XRP price started a downside correction from the $3.220 zone.
- The price is now trading above $3.050 and the 100-hourly Simple Moving Average.
- There was a break above a bullish flag pattern forming with resistance at $3.10 on the hourly chart of the XRP/USD pair (data source from Kraken).
- The pair might start a fresh increase if it clears the $3.20 resistance zone.
XRP Price Eyes Fresh Gains
XRP price started a fresh increase above the $2.950 zone, outperforming Bitcoin and Ethereum. The price rallied above the $2.95 and $3.00 resistance levels.
A high was formed at $3.214 and the price recently corrected some gains. There was a move below the $3.10 level. The price dipped toward the 50% Fib retracement level of the upward wave from the $2.6560 swing low to the $3.214 high.
However, the bulls were active near $3.00 and pushed the price higher. There was a break above a bullish flag pattern forming with resistance at $3.10 on the hourly chart of the XRP/USD pair.
The price is now trading above $3.050 and the 100-hourly Simple Moving Average. On the upside, the price might face resistance near the $3.150 level. The first major resistance is near the $3.20 level. The next resistance is $3.220.

A clear move above the $3.220 resistance might send the price toward the $3.320 resistance. Any more gains might send the price toward the $3.380 resistance or even $3.420 in the near term. The next major hurdle for the bulls might be $3.50.
Another Decline?
If XRP fails to clear the $3.150 resistance zone, it could start another decline. Initial support on the downside is near the $3.00 level. The next major support is near the $2.950 level.
If there is a downside break and a close below the $2.950 level, the price might continue to decline toward the $2.860 support or the 61.8% Fib retracement level of the upward wave from the $2.6560 swing low to the $3.214 high. The next major support sits near the $2.750 zone.
Technical Indicators
Hourly MACD – The MACD for XRP/USD is now losing pace in the bullish zone.
Hourly RSI (Relative Strength Index) – The RSI for XRP/USD is now below the 50 level.
Major Support Levels – $3.00 and $2.950.
Major Resistance Levels – $3.150 and $3.20.
]]>After Bitcoin’s BTC/USD spike, it appears that it’s the turn of Dogecoin DOGE/USD to play catch up with the apex crypto.
What Happened: DOGE, which bottomed in late 2022, began a short-term uptrend at the start of the new year. It hit a resistance area around $0.0918 on Jan. 14, but could not successfully go past the level.
After retracing some of the gains, the meme crypto found support around the $0.08 level. Since Friday, Doge has picked up additional momentum amid the general increase in risk appetite. It moved in the $0.0808-$0.0868 range on Friday.
After hitting an intraday high of $0.887 on Saturday, DOGE settled the session at $0.0848. Come Sunday, the upward momentum has accelerated, pushing the crypto past the $0.090 level, marking its highest price since mid-December.
See also: Is Dogecoin A Good Investment
Why It’s Important: Dogecoin’s run-up on Sunday came despite the Bitcoin rally losing steam. The rally could be a technical move as the crypto approached the near-term resistance. The upside has not been accompanied by a pick-up in volume, probably due to the typical light-volume trading witnessed during the weekend. A move past another resistance area around $0.0112 could lend some more credibility to the rally.
At last check, Dogecoin was up 8.75% in 24 hours to $0.09221, according to Benzinga Pro data.
Read next: Analyst Says Bitcoin Surge Has Just Begun, Anticipates This Price Target By February