Shiba Inu (SHIB) Wipes 7.9B Shorts While Taurox (TAUX) AI Hedge Fund Earns in Any Market Conditions CoinCentral
Source link ]]>
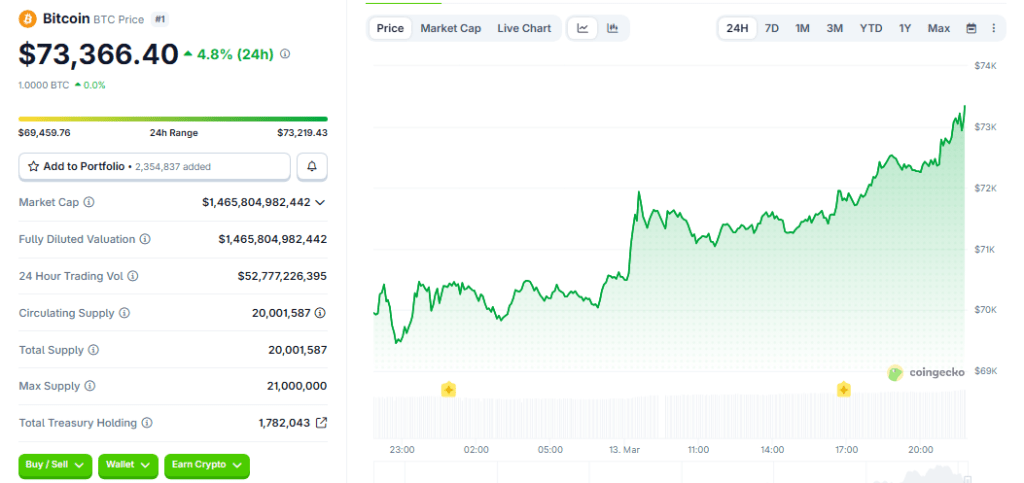
More than $246 million in crypto futures positions were wiped out in a single day as Bitcoin reversed sharply on Thursday, punishing traders who had bet against the market.
The leading cryptocurrency climbed back to around $73,300 — a gain of roughly 4.5% over 24 hours — after a stretch of selling had dragged prices into the high $60,000 range.
Related Reading
The move carried the hallmarks of a short squeeze. Funding rates had gone deeply negative in the days before the reversal, a sign that bearish bets had piled up on exchanges. When prices turned higher, those positions were forced to close. Volume surged, and the rally fed on itself.
Buyers Step In Ahead Of Major Resistance
Bitcoin had been trading near $71,500 before buyers moved in. Reports from trading data firm TradingView placed the price at approximately $72,900 at publication time.
The recovery came against a backdrop of broader risk appetite returning to financial markets, with the S&P 500 posting gains and the US dollar softening — conditions that have historically drawn money into alternative assets like Bitcoin.
Institutional demand played a role too. Inflows into spot Bitcoin exchange-traded funds helped put a floor under prices during earlier sell-offs this year, keeping losses shallower than they might otherwise have been.
That dynamic marks a notable shift from past cycles, when Bitcoin often fell in lockstep with equities during periods of stress.
Geopolitical tensions in the Middle East added a layer of uncertainty throughout the week, but Bitcoin held its ground, a fact traders pointed to as evidence of broader market acceptance of the asset.
Open Interest Stays Elevated At $48B
The derivatives market remains stretched. Open interest across major exchanges sat near $48 billion, according to data aggregated by Coinglass, with CME Bitcoin futures alone accounting for roughly $7.9 billion — or around 110,000 BTC.
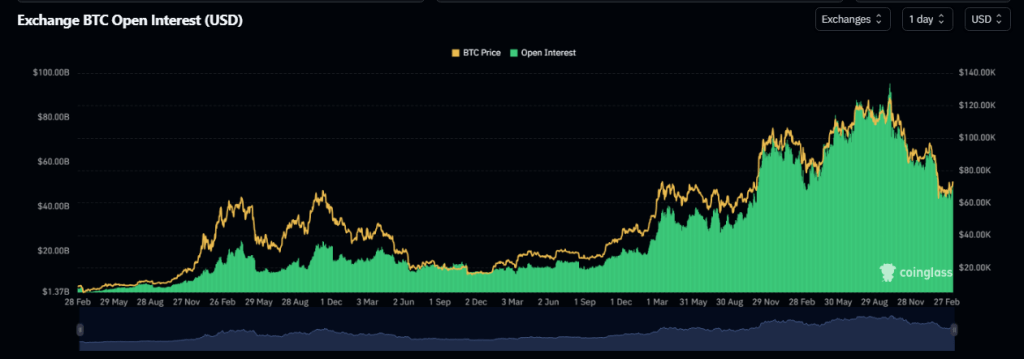
Positioning had shifted toward call options heading into the move, suggesting some traders had already anticipated a push higher.
That level of open interest cuts both ways. It reflects strong participation and genuine conviction from both retail and institutional traders.
Related Reading
But it also means the market stays vulnerable to sharp swings if headlines change fast. A single piece of macro news — a Federal Reserve signal, an escalation overseas, a policy shift — could flip the mood quickly.
Bitcoin has shed its old reputation as a pure risk-on trade, at least partly. Advocates increasingly frame it as a store of value in environments where governments spend freely and currencies weaken.
Whether that framing holds under pressure remains an open question, but Thursday’s recovery did little to discourage those who believe it.
Featured image from Pexels, chart from TradingView
Shiba Inu Price Drops After $333K Liquidation Wipes Out 59 Billion SHIB Tokens Coinpaper
Source link ]]>
Bitcoin’s recent wobble has traders on edge, but the picture is not all one-way. Reports note heavy losses for late buyers, and on-chain figures show real money changing hands as positions are forced closed. Markets moved fast; the mood did too.
Related Reading
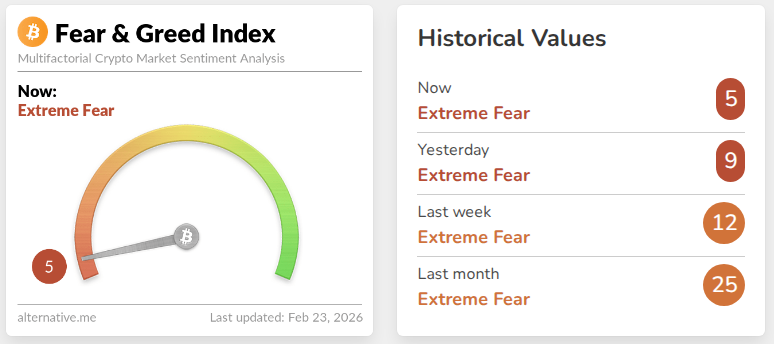
Fear And Greed Plunges To Single Digits
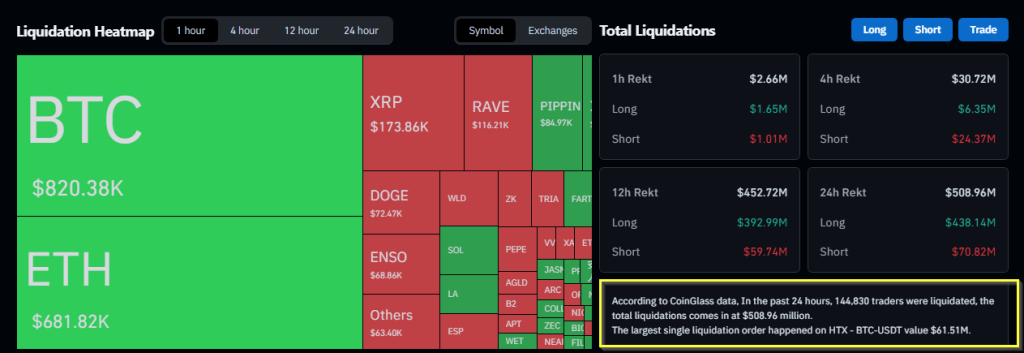
According to CoinGlass, more than 144,839 traders were liquidated in the last 24 hours, with total liquidations of over $508 million and about 92% tied to long bets.
Reports from Alternative.me put the Crypto Fear and Greed Index at 5 out of 100 — a reading that has turned up only three times since 2018.
That level screams panic. Yet panic often clears out the most fragile holders and leaves room for steadier hands to step in.
Realized Losses And Capitulation Signals
Based on reports from Glassnode, recent investors are still booking losses at a high rate — the seven-day moving average for net realized losses was close to $500 million per day.
That kind of selling pressure looks brutal on a chart. At the same time, selling at scale can mark an end to a sharp phase of decline, because it reduces the number of people left to sell when prices fall further.
Bitcoin Price Action
In the middle of all this, price moves matter. Bitcoin rose to roughly $68,600 on Saturday, but it slid back and touched the mid-$64,000s after a wave of exits.
Traders are watching a range that formed after the early-February drop to about $60,000. The coin remains roughly 48% below an October high of $126,000 and about 5.5% under the 2021 peak near $69,000.
News tied to US-Iran tension and general risk-off trading pushed some traders toward safer assets, which added fuel to the pullback.
Sharpe Ratio Hits Unusual Low
Analyst Michaël van de Poppe shared a chart showing Bitcoin’s Sharpe Ratio at -38.4. That metric measures returns relative to risk; a number this low is rare.
This is a phenomenal chart.
It shows the Sharpe Ratio for #Bitcoin in the short term.
The key takeaway: the Sharpe Ratio has dropped to -38.38, which historically has marked “Low Risk” accumulation zones. The red circles highlight every time the Sharpe Ratio dipped to similar… pic.twitter.com/Nwp7SkfVP4
— Michaël van de Poppe (@CryptoMichNL) February 21, 2026
Historically, extreme negative readings have sometimes lined up with moments when buying risk felt lower, because potential downside had been squeezed out by big selloffs.
That does not guarantee a rebound, but it changes how investors view the trade-off between reward and risk.
Related Reading
Where This Could Lead
Some technical watchers warn that more tests of support could happen if uncertainty continues. Others point to the combination of heavy liquidations, deep fear readings, and large realized losses as signals that a base might be forming.
Pasts on-chain figures show that panic and steep losses often precede quieter periods where buyers return slowly.
Featured image from Unsplash, chart from TradingView
Dogecoin Struggles At $0.10 After Correction Wipes Recent Gains Yellow.com
Source link ]]>
Cardano wipes out two-thirds of its intraday gains in few hours TheStreet
Source link ]]>
Cardano and Dogecoin Roar Back after ‘Emotional Reset’ Wipes $19B From Crypto Markets TipRanks
Source link ]]>
Dogecoin (DOGE) Price: Drops 18% as Weekend Massacre Wipes Out Recent Gains CoinCentral
Source link ]]>
Shiba Inu Price’s 16% Drop Wipes Half Of July Gains; Is August In Trouble? BeInCrypto
Source link ]]>
Massive Crash Wipes Billions from Litecoin & Cardano Market Cap, Unilabs Crushes $500,000 Milestone FinanceFeeds
Source link ]]>