Shiba Inu Price Analysis: Can SHIB Withstand Bearish Pressure as Investors Favor BTC and ETH The Crypto Basic
Source link ]]>
BNB price is attempting a fresh increase from the $540 zone. The price must settle above the $600 resistance to gain bullish momentum.
- BNB price started a fresh increase after it cleared the $565 resistance zone.
- The price is now trading above $580 and the 100 simple moving average (4 hours).
- There is a key bullish trend line forming with support at $592 on the 4-hour chart of the BNB/USD pair (data source from Binance).
- The pair could gain bullish momentum if it clears the $602-$610 resistance zone.
BNB Price Holds Support
After forming a base above the $535 level, BNB price started a fresh increase. There was a steady increase above the $565 and $575 resistance levels, like Ethereum and Bitcoin.
The bulls pushed the price above the $580 pivot level and the 61.8% Fib retracement level of the downward move from the $618 swing high to the $5382 low. It is now trading above $590 and the 100 simple moving average (4 hours).
There is also a key bullish trend line forming with support at $592 on the 4-hour chart of the BNB/USD pair. The pair seems to be consolidating near the 76.4% Fib retracement level of the downward move from the $618 swing high to the $5382 low.
Immediate resistance is near the $602 level. The next resistance sits near the $618 level. A clear move above the $618 zone could send the price further higher.
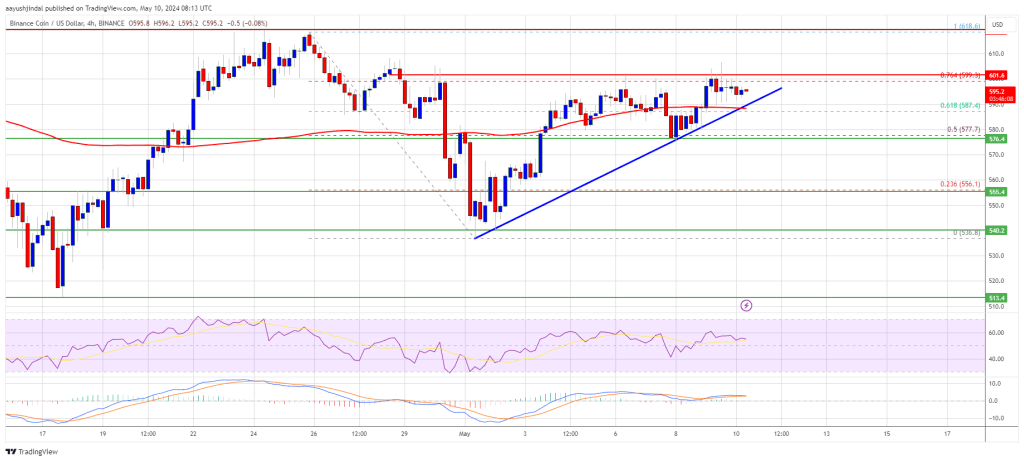
Source: BNBUSD on TradingView.com
In the stated case, BNB price could test $635. A close above the $635 resistance might set the pace for a larger increase toward the $650 resistance. Any more gains might call for a test of the $680 level in the coming days.
Are Dips Supported?
If BNB fails to clear the $602 resistance, it could start a downside correction. Initial support on the downside is near the $592 level and the trend line.
The next major support is near the $578 level. The main support sits at $555. If there is a downside break below the $555 support, the price could drop toward the $530 support. Any more losses could initiate a larger decline toward the $520 level.
Technical Indicators
4-Hours MACD – The MACD for BNB/USD is gaining pace in the bullish zone.
4-Hours RSI (Relative Strength Index) – The RSI for BNB/USD is currently above the 50 level.
Major Support Levels – $592, $578, and $555.
Major Resistance Levels – $602, $618, and $650.
]]>Ethereum price is attempting a recovery wave above the $3,125 zone. ETH must clear the $3,200 resistance to continue higher in the near term.
- Ethereum extended losses and tested the $3,075 support zone.
- The price is trading below $3,180 and the 100-hourly Simple Moving Average.
- There is a key rising channel forming with support at $3,140 on the hourly chart of ETH/USD (data feed via Kraken).
- The pair could continue to move down if it trades below the $3,125 support.
Ethereum Price Faces Resistance
Ethereum price struggled to recover and extended losses below the $3,100 level. ETH traded as low as $3,074 and is currently attempting another recovery wave, like Bitcoin.
There was a minor increase above the $3,125 resistance. The price climbed above the 23.6% Fib retracement level of the recent drop from the $3,292 swing high to the $3,074 low. However, the bears are active near the $3,200 resistance zone.
Ethereum is now trading below $3,180 and the 100-hourly Simple Moving Average. There is also a key rising channel forming with support at $3,140 on the hourly chart of ETH/USD. Immediate resistance is near the $3,180 level and the 100-hourly Simple Moving Average.
The first major resistance is near the $3,200 level or the 61.8% Fib retracement level of the recent drop from the $3,292 swing high to the $3,074 low.
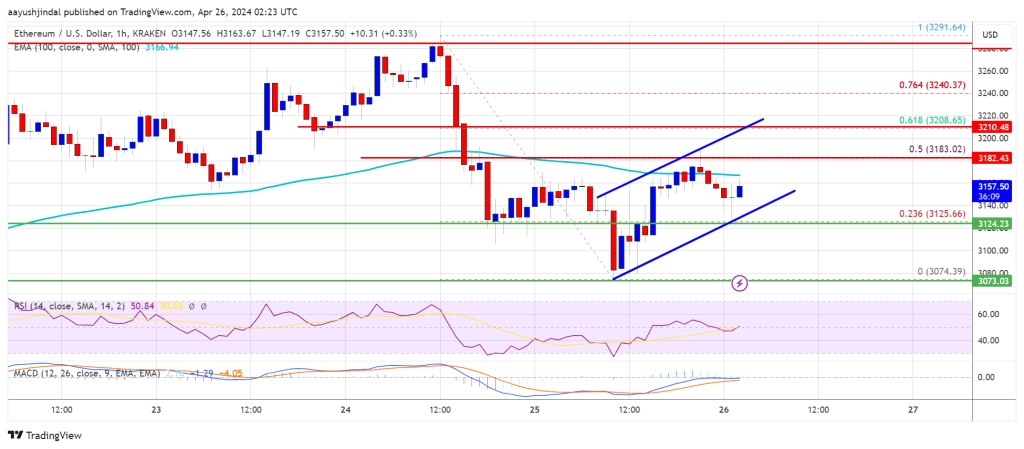
Source: ETHUSD on TradingView.com
The next key resistance sits at $3,240, above which the price might gain traction and rise toward the $3,280 level. A close above the $3,280 resistance could send the price toward the $3,350 resistance. If there is a move above the $3,350 resistance, Ethereum could even test the $3,500 resistance. Any more gains could send Ether toward the $3,550 resistance zone.
More Downsides In ETH?
If Ethereum fails to clear the $3,180 resistance, it could continue to move down. Initial support on the downside is near the $3,125 level. The first major support is near the $3,075 zone.
The main support is near the $3,030 level. A clear move below the $3,030 support might set the pace for more losses and send the price toward $2,880. Any more losses might send the price toward the $2,750 level in the near term.
Technical Indicators
Hourly MACD – The MACD for ETH/USD is losing momentum in the bearish zone.
Hourly RSI – The RSI for ETH/USD is now below the 50 level.
Major Support Level – $3,125
Major Resistance Level – $3,200
]]>Ethereum price is still consolidating near the $3,000 zone. ETH could start a steady increase if the bulls push the price above the $3,100 resistance.
- Ethereum is still struggling to recover above the $3,100 resistance zone.
- The price is trading below $3,100 and the 100-hourly Simple Moving Average.
- There is a key bearish trend line forming with resistance at $3,070 on the hourly chart of ETH/USD (data feed via Kraken).
- The pair could accelerate lower if there is a close below the $2,850 support zone.
Ethereum Price Consolidates
Ethereum price attempted another recovery wave and remained stable above the $3,000 level. However, the bears defended the $3,100 resistance zone, like Bitcoin.
There was another decline below $3,000. The price even spiked below the $2,900 support. A low was formed at $2,867 and the price is now recovering losses. It climbed above the 23.6% Fib retracement level of the downward move from the $3,278 swing high to the $2,867 low.
Ethereum is still trading below $3,100 and the 100-hourly Simple Moving Average. Immediate resistance is near the $3,020 level. The first major resistance is near the $3,070 level and the 100-hourly Simple Moving Average.
There is also a key bearish trend line forming with resistance at $3,070 on the hourly chart of ETH/USD. The trend line is close to the 50% Fib retracement level of the downward move from the $3,278 swing high to the $2,867 low. The next key resistance sits at $3,120, above which the price might rise toward the $3,200 level.
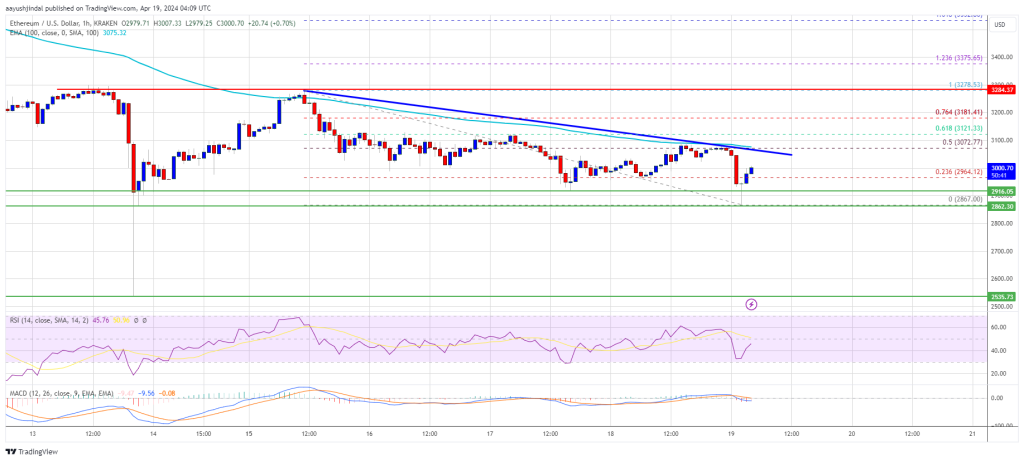
Source: ETHUSD on TradingView.com
The main downtrend resistance sits at $3,280. A close above the $3,280 resistance could send the price toward the $3,350 pivot level. If there is a move above the $3,350 resistance, Ethereum could even climb toward the $3,550 resistance.
More Losses In ETH?
If Ethereum fails to clear the $3,100 resistance, it could start another decline. Initial support on the downside is near the $2,920 level. The first major support is near the $2,850 zone.
A clear move below the $2,850 support might send the price toward $2,620. Any more losses might send the price toward the $2,550 level in the near term.
Technical Indicators
Hourly MACD – The MACD for ETH/USD is gaining momentum in the bearish zone.
Hourly RSI – The RSI for ETH/USD is now below the 50 level.
Major Support Level – $2,850
Major Resistance Level – $3,100
]]>Ethereum price is struggling to recover above the $3,440 resistance zone. ETH is moving lower and might decline further if it clears the $3,250 support.
- Ethereum is struggling to climb above the $3,370 and $3,440 levels.
- The price is trading below $3,380 and the 100-hourly Simple Moving Average.
- There was a break below a major bullish trend line with support at $3,300 on the hourly chart of ETH/USD (data feed via Kraken).
- The pair could extend losses if there is a close below the $3,250 support zone.
Ethereum Price Recovery Fades Again
Ethereum price attempted a fresh recovery wave above the $3,300 and $3,320 levels, like Bitcoin. ETH even climbed above the $3,400 level, but the bears were active near the $3,440 zone.
A high was formed near $3,443 before there was a fresh decline. There was a break below a major bullish trend line with support at $3,300 on the hourly chart of ETH/USD. The price trimmed gains and retested the $3,250 support. The price traded as low as $3,253 and is currently consolidating losses.
It is trading just above the 23.6% Fib retracement level of the downward wave from the $3,443 swing high to the $3,253 low. However, Ethereum is trading below $3,380 and the 100-hourly Simple Moving Average.
Immediate resistance is near the $3,320 level. The first major resistance is near the $3,350 level or the 50% Fib retracement level of the downward wave from the $3,443 swing high to the $3,253 low. The next key resistance sits at $3,440, above which the price might test the $3,500 level.
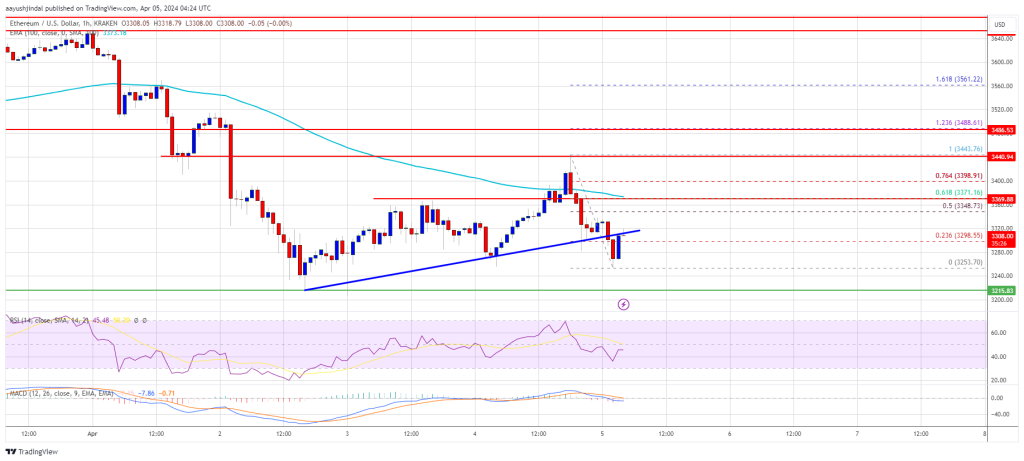
Source: ETHUSD on TradingView.com
The next key resistance is seen near the $3,550 level, above which Ether could gain bullish momentum. In the stated case, the price could rise toward the $3,650 zone. If there is a move above the $3,650 resistance, Ethereum could even rise toward the $3,750 resistance.
More Losses In ETH?
If Ethereum fails to clear the $3,350 resistance, it could continue to move down. Initial support on the downside is near the $3,250 level.
The first major support is near the $3,220 zone. The next key support could be the $3,200 zone. A clear move below the $3,200 support might send the price toward $3,120. Any more losses might send the price toward the $3,040 level.
Technical Indicators
Hourly MACD – The MACD for ETH/USD is gaining momentum in the bearish zone.
Hourly RSI – The RSI for ETH/USD is now below the 50 level.
Major Support Level – $3,250
Major Resistance Level – $3,350
]]>Ethereum price struggled to clear $2,720 and corrected gains. ETH is now struggling to stay above the key $2,440 support zone and might extend losses.
- Ethereum climbed further higher toward $2,720 before the bears appeared.
- The price is trading below $2,550 and the 100-hourly Simple Moving Average.
- There is a connecting bearish trend line forming with resistance near $2,520 on the hourly chart of ETH/USD (data feed via Kraken).
- The pair could start a downside thrust if it breaks the $2,440 support zone.
Ethereum Price Revisits Support
Ethereum price outpaced Bitcoin and extended its increase above the $2,550 resistance. ETH even broke the $2,600 zone and spiked above $2,700. Finally, the beards appeared near the $2,720 resistance.
A new multi-week high was formed near $2,716 before the price corrected gains. There was a move below the $2,600 and $2,550 levels. The price declined below the 23.6% Fib retracement level of the upward move from the $2,170 swing low to the $2,716 high.
Ethereum is now trading below $2,550 and the 100-hourly Simple Moving Average. If there is a fresh increase, the price might face resistance near the $2,520 level. There is also a connecting bearish trend line forming with resistance near $2,520 on the hourly chart of ETH/USD.
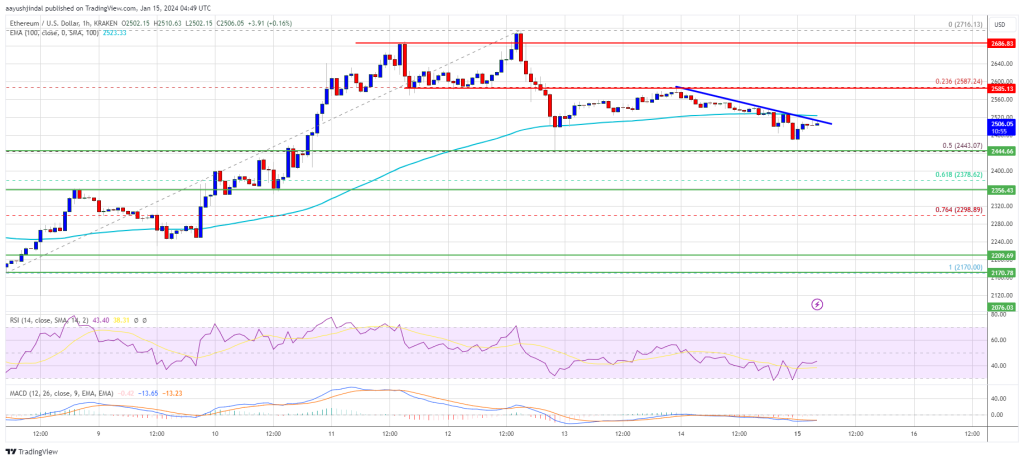
Source: ETHUSD on TradingView.com
The next major resistance is now near $2,585. A clear move above the $2,585 level might send ETH toward $2,650. The main resistance is now forming near the $2,720 level. A close above the $2,720 resistance could push the price further into a bullish zone. The next key resistance is near $2,780. Any more gains might send the price toward the $2,880 zone.
More Losses in ETH?
If Ethereum fails to clear the $2,520 resistance, it could continue to move down. Initial support on the downside is near the $2,440 level or the 50% Fib retracement level of the upward move from the $2,170 swing low to the $2,716 high.
The next key support could be the $2,350 zone. A downside break below the $2,350 support might send the price further lower. In the stated case, Ether could test the $2,300 support. Any more losses might send the price toward the $2,240 level.
Technical Indicators
Hourly MACD – The MACD for ETH/USD is losing momentum in the bullish zone.
Hourly RSI – The RSI for ETH/USD is now below the 50 level.
Major Support Level – $2,440
Major Resistance Level – $2,585
]]>GameStop Memes Raises $2M in 24Hrs! Shiba Inu and Dogecoin Face Competition – Can They Withstand GSM’s Rise? Analytics Insight
Source link ]]>
Ethereum price started a steady increase from the $1,520 zone against the US dollar. ETH is now struggling to clear the $1,605 and $1,620 resistance levels.
- Ethereum is attempting a recovery wave above the $1,570 level.
- The price is trading just above $1,575 and the 100-hourly Simple Moving Average.
- There is a key bullish trend line forming with support near $1,572 on the hourly chart of ETH/USD (data feed via Kraken).
- The pair could rise further if there is a close above the $1,620 resistance level.
Ethereum Price Gains Traction
Ethereum started a fresh increase from the $1,520 level. ETH gained traction like Bitcoin and spiked above the $1,600 resistance level. It even climbed above $1,620, but the bears appeared near $1,650.
A high was formed near $1,669 before there was a fresh decline. Ether trimmed gains and settled below the $1,600 level. It tested the $1,575 support and is currently consolidating near the 23.6% Fib retracement level of the recent decline from the $1,669 swing high to the $1,574 low.
Ethereum is now trading just above $1,575 and the 100-hourly Simple Moving Average. There is also a key bullish trend line forming with support near $1,572 on the hourly chart of ETH/USD.
On the upside, the price is facing resistance near the $1,605 level. The first major resistance is near the 50% Fib retracement level of the recent decline from the $1,669 swing high to the $1,574 low at $1,620. A close above the $1,620 resistance might start a decent increase.
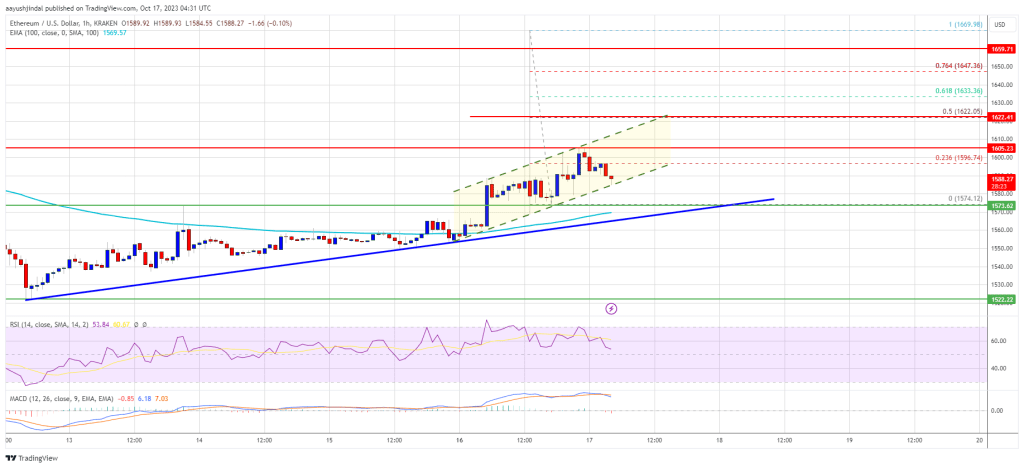
Source: ETHUSD on TradingView.com
In the stated case, Ether could rise and recover toward the $1,665 resistance. Any more gains might open the doors for a move toward $1,750.
Another Decline in ETH?
If Ethereum fails to clear the $1,605 resistance, it could start another decline. Initial support on the downside is near the $1,575 level and the 100-hourly Simple Moving Average.
The next key support is $1,550. A downside break below the $1,550 support might send the price further lower. In the stated case, the price could drop toward the $1,520 level. Any more losses may perhaps send Ether toward the $1,440 level.
Technical Indicators
Hourly MACD – The MACD for ETH/USD is losing momentum in the bullish zone.
Hourly RSI – The RSI for ETH/USD is now above the 50 level.
Major Support Level – $1,575
Major Resistance Level – $1,620
]]>Ethereum price is consolidating above the $1,550 support against the US dollar. ETH could decline heavily if the bulls fail to protect $1,550 and $1,540.
- Ethereum is struggling to start a recovery wave from $1,550.
- The price is trading below $1,585 and the 100-hourly Simple Moving Average.
- There are two bearish trend lines forming with resistance near $1,565 and $1,590 on the hourly chart of ETH/USD (data feed via Kraken).
- The pair could start a recovery wave if the bulls defend the $1,550 support zone.
Ethereum Price Faces Resistance
Ethereum remained in a bearish zone below the $1,600 resistance zone. ETH is still consolidating above the $1,550 support and showing bearish signs, like Bitcoin.
The recent low was formed near $1,542 before the price started a consolidation phase. The price spiked once above the 23.6% Fib retracement level of the key decline from the $1,665 swing high to the $1,542 low, but upsides were limited.
Ethereum is now trading below $1,585 and the 100-hourly Simple Moving Average. There are also two bearish trend lines forming with resistance near $1,565 and $1,590 on the hourly chart of ETH/USD.
On the upside, the price might face resistance near the $1,565 level and the first trend line. The first major resistance is near the second trend line, $1,590, and the 100-hourly Simple Moving Average. The next resistance is near $1,600 or the 50% Fib retracement level of the key decline from the $1,665 swing high to the $1,542 low.
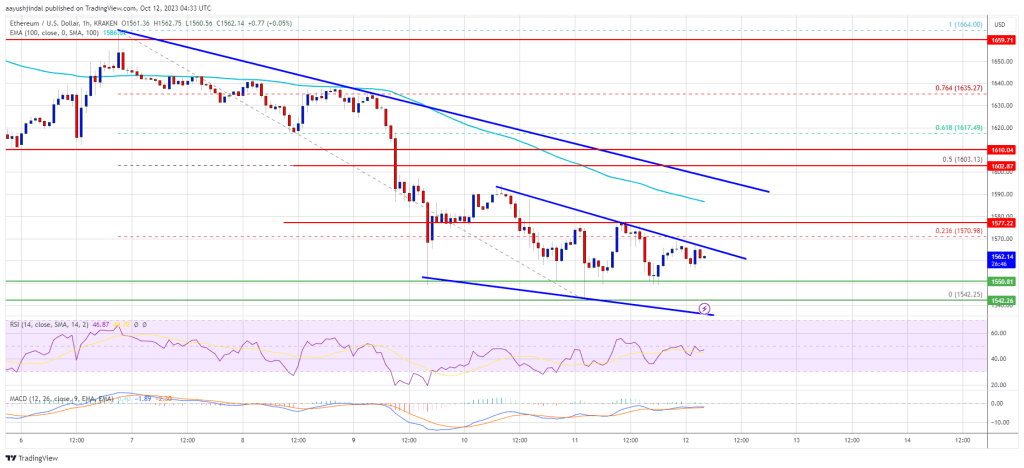
Source: ETHUSD on TradingView.com
A clear move above the $1,600 resistance might start a short-term recovery wave. In the stated case, Ether could rise and recover toward the $1,665 resistance. Any more gains might open the doors for a move toward $1,750.
More Losses in ETH?
If Ethereum fails to clear the $1,600 resistance, it could continue to move down. Initial support on the downside is near the $1,550 level. The next key support is $1,540.
A downside break below the $1,540 support might spark another strong decline. In the stated case, the price could drop toward the $1,420 level. Any more losses may perhaps send Ether toward the $1,350 level.
Technical Indicators
Hourly MACD – The MACD for ETH/USD is losing momentum in the bearish zone.
Hourly RSI – The RSI for ETH/USD is now below the 50 level.
Major Support Level – $1,540
Major Resistance Level – $1,600
]]>Dogecoin Price Faces Crucial Test: Will $0.055 Withstand The Pressure? NewsBTC
Source link ]]>