- Cardano price is on the edge of falling further toward $1.26 as the Ethereum-killer is struggling to find a reliable foothold.
- The governing technical pattern suggests that ADA could see a decline of 15%.
- The lack of meaningful support could spell trouble for the bulls.
Cardano price is on the brink of further decline as ADA fails to secure crucial footholds. The governing technical pattern suggests a bearish forecast of a 15% decline as the Ethereum killer struggles to find buyers in the market.
Cardano price to retest $1.26
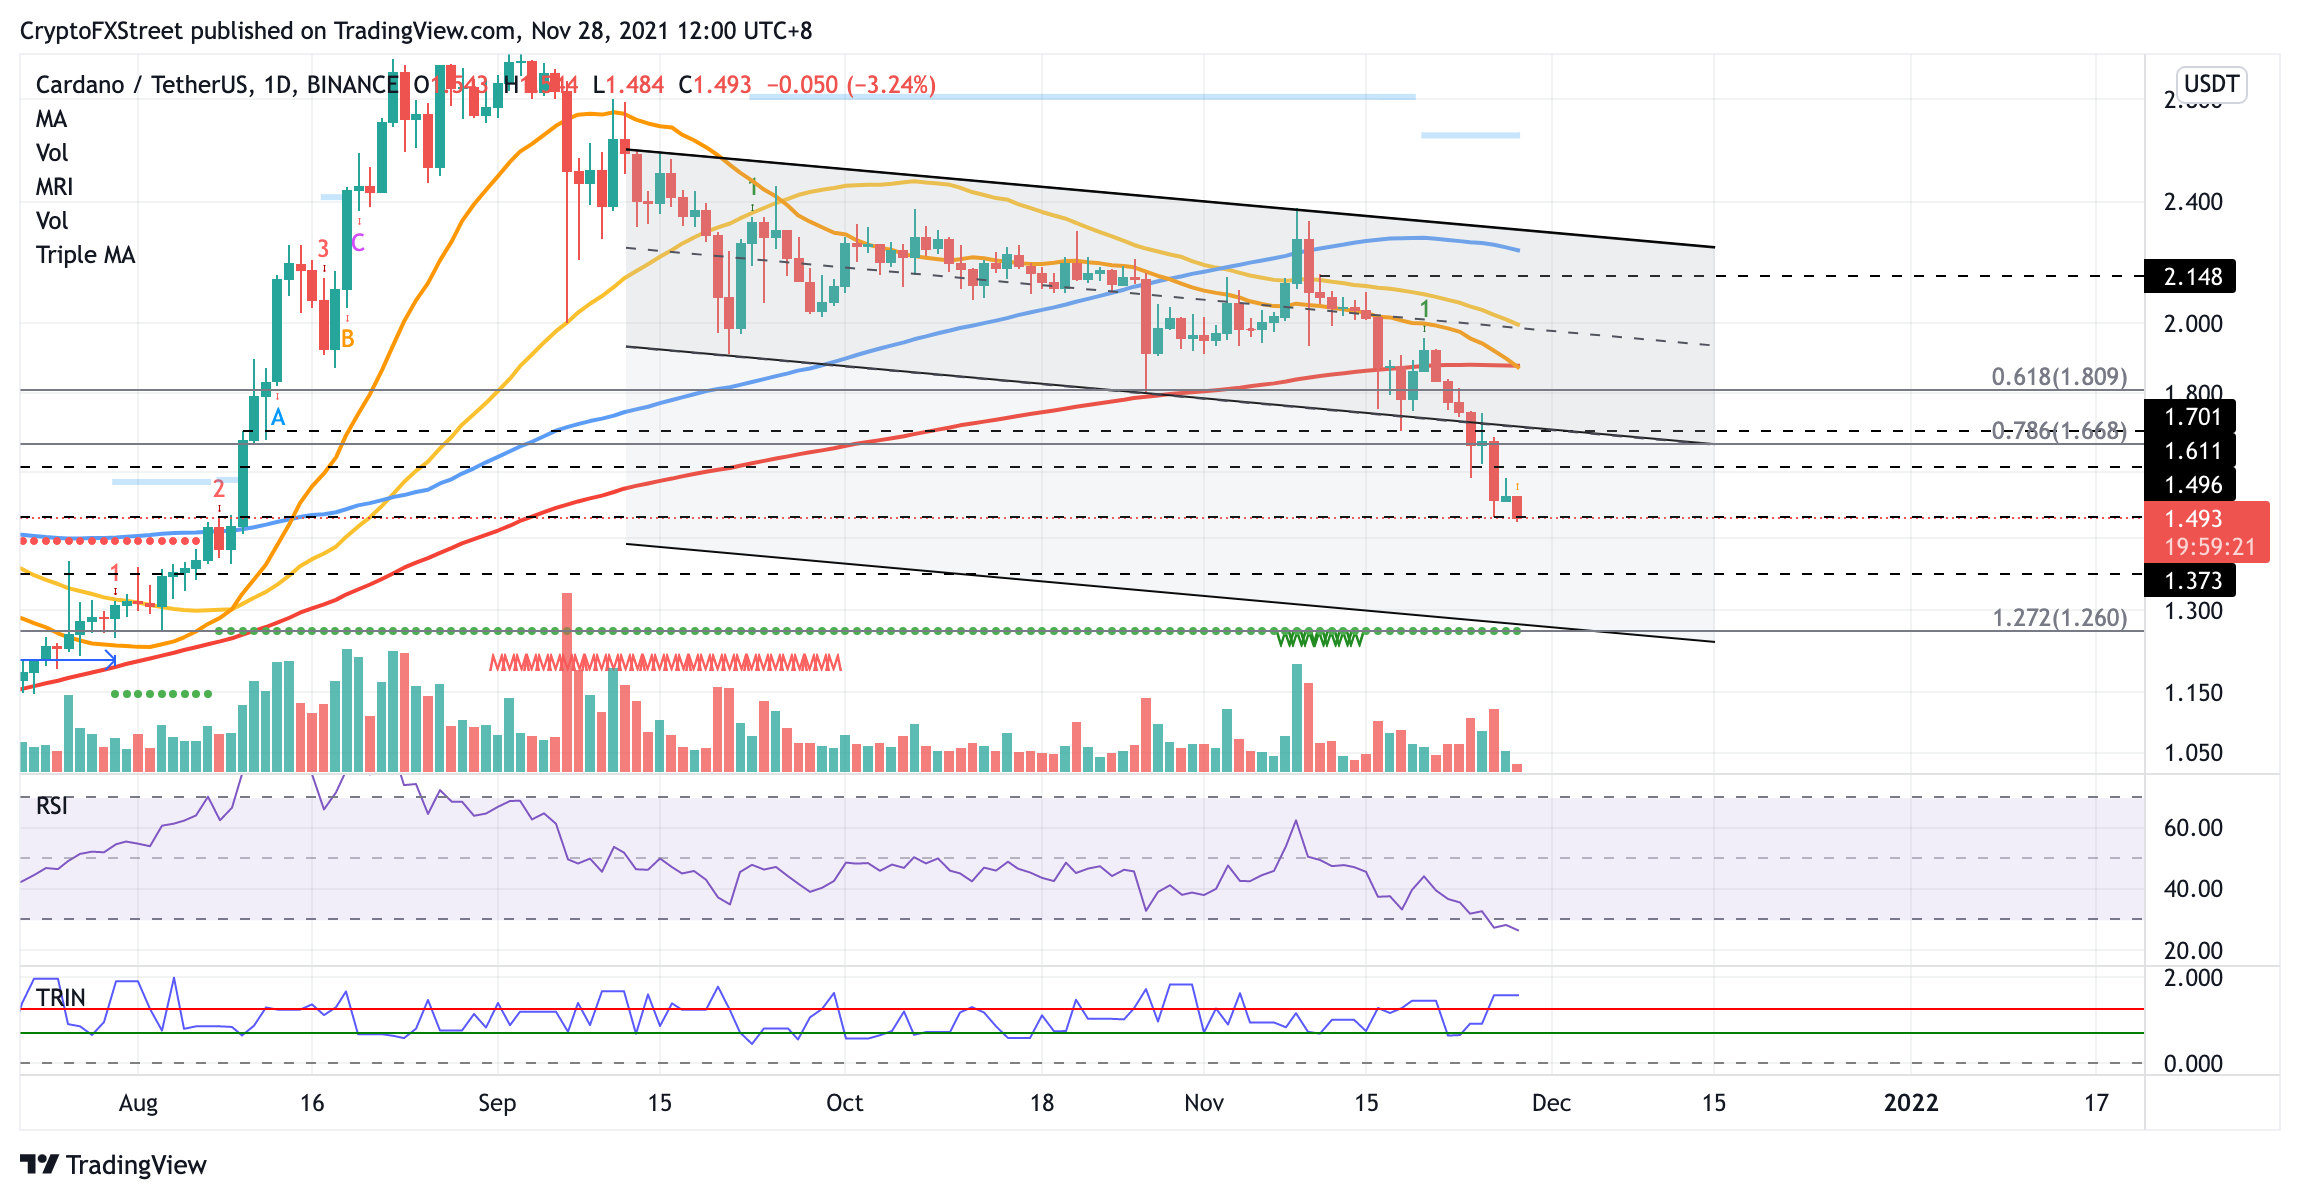
Cardano price has sliced below the descending parallel channel on that formed since September 12, signaling further losses are in store. The prevailing chart pattern suggests a 25% plunge toward $1.26 if ADA is unable to find crucial support to prevent greater decline.
Since breaking below the lower boundary of the parallel channel on November 24 at $1.72, Cardano price has continued to drop 13%, recording a new swing low at $1.48.
It appears that the nearest line of defense for Cardano price is at the July 10 high at $1.37.
If Cardano price fails to hold above the aforementioned foothold, ADA could plunge toward the bearish target at $1.26, where the support line given by the Momentum Reversal Indicator (MRI) and 127.2% Fibonacci retracement level coincide.
The Arms Index (TRIN), which gauges overall market sentiment, suggests that there are significantly more sellers than buyers in the market, pointing to an overall pessimistic outlook for Cardano price.
The recent sell-off was most likely kickstarted by eToro’s delisting of ADA, causing investors to back out. Prominent crypto attorney Jeremy Hogan suggested that the most likely reason for the exchange to stop Cardano trading was due to a warning from the United States Securities & Exchange Commission (SEC).
ADA/USDT daily chart
However, if the bulls decide to step in, the first resistance for Cardano price is at the July 4 high at $1.49, then at the June 15 high at $1.61. Additional hurdles may emerge for ADA at the 78.6% Fibonacci retracement level at $1.66, then at the 61.8% Fibonacci retracement level at $1.80.
Investors should also note that the 21-day Simple Moving Average (SMA) crossed below the 200-day SMA at $1.88, which indicates this level would be a tough challenge to crack for ADA while suggesting a bearish signal for Cardano price.


