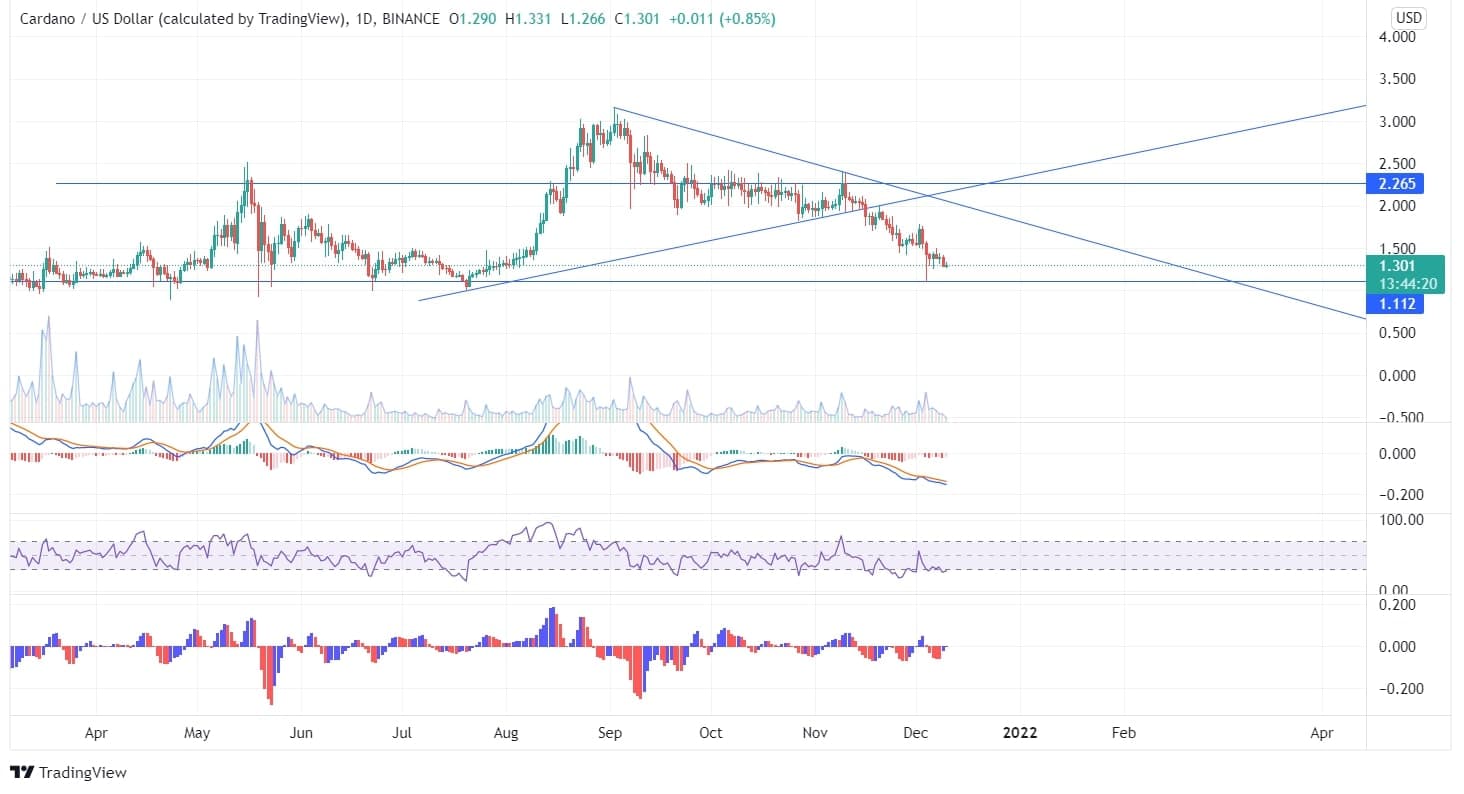
Cardano’s price was at its peak on September 03. During September, the coin gave a significant return. However, later, it faced tremendous bearish pressure.
Cardano is in a downside pattern and is revolving at its support line with the current price of $1.30. There was an existence of a bearish engulfing pattern in the previous two days, which may lead to the further downfall of the coin. ADA is moving within the triangular pattern formed, and one can make recommendations on future price flow once the price suppresses the triangle line and moves in one direction.
 On the daily chart, the MACD indicator has already given a bearish signal with green candles in the histogram chart. ADA is already 90% down from when the MACD gave a sell signal. The RSI being at 28, is in its oversold zone and is expected to fall further.
There is a bullish engulfing pattern between the price and the indicator, which may be an opportunity for investors. If the price begins to recover from this point and takes a U-turn, a strong bullish momentum can be expected in the future. ADA is moving in between the channels, and though the price got tested several times at the upper channel line but failed to break the line and uplift.
From the past 4 weeks, there has been a constant formation of bearish candles in the weekly chart with lower highs and lower lows. ADA is in downward momentum with a full price breakdown. The coin may recover from this point if there is an augment in price by the bullish investors and the price rises from its support zone.
Investors should wait before investing as currently, the market is in bearish momentum and may take a U-turn at any point in time.


