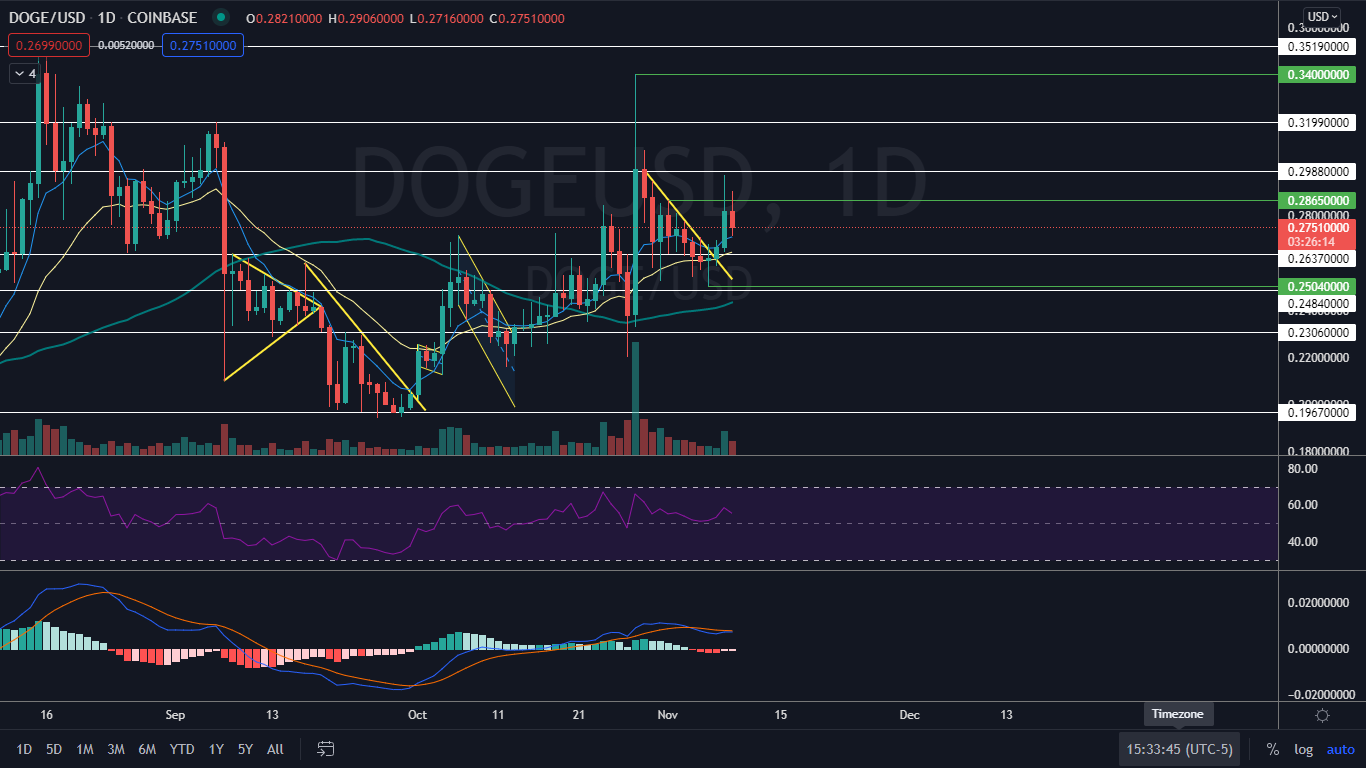
Dogecoin (CRYPTO: DOGE) broke up bullishly on Sunday from a descending triangle pattern Benzinga called out two days prior. The crypto then soared almost 12% higher with momentum on Monday but rejected and wicked from a resistance level near the $0.298 mark.
Dogecoin Core, the official wallet many traders, investors and third-party wallets use to manage selling and buying Dogecoin, released its 1.14.5 update on Monday. The minor version release includes security updates and a reduction to the recommended fees.
The latest update decreases the transaction fee by almost 10 times, from 1 DOGE/kb to a recommended minimum of 0.1 DOGE/kb. Lowering fees gives Dogecoin more utility because it can more easily be accepted as a payment option.
See Also: Are Dogecoin And Shiba Inu On Track For Recovery?
The Dogecoin Chart: On Tuesday, Dogecoin was settling into an inside bar pattern on the daily chart, with the entirety of the 24-hour hour price range taking place within Monday’s range. The formation is considered bullish because Dogecoin was trading higher before forming the pattern. Traders can watch for a break from the inside bar on Wednesday, on high volume, to gauge whether the pattern was recognized.
The inside bar was taking place on lower-than-average 24-hour volume, which is indicative of consolidation. It is possible Dogecoin creates a double inside bar on Wednesday, which would also be bullish.
Dogecoin made the first sign of a possible bullish trend change on Monday with the crypto printed a higher high above the Nov. 1 high of $0.286. For the uptrend to be confirmed, Dogecoin will eventually need to print a higher low above the 25-cent level on the 24-hour chart.
The crypto’s moving average convergence divergence (MACD) indicator appears bullish because it indicates the MACD (blue) may cross above the signal line (orange) in the near future. Technical traders interpret the event of MACD crossing above the signal line as a bullish crossover, which can be a buy signal.
Dogecoin is trading above the eight-day and 21-day exponential moving averages (EMAs) with the eight-day EMA trending above the 21-day, both of which are bullish indicators. The crypto is also trading above the 50-day simple moving average, which indicates longer-term sentiment is bullish.
- Bulls want to see big bullish volume come in to break Dogecoin up from the inside bar pattern and for momentum to push the crypto over the $0.298 mark. If Dogecoin can regain the level as support it has room to trade back up toward $0.319.
- Bears want to see big bearish volume come in and drop Dogecoin down below the 25-cent level, which would indicate Monday’s price action was a bear trap and the downtrend is still intact. Dogecoin has support below at $0.263 and $0.248.

Want direct analysis? Find me in the BZ Pro lounge! Click here for a free trial.
Photo by Executium on Unsplash


