Dogecoin price analysis shows a bullish trend for the day as buyers’ participation has increased and more buying activity has been taking place in the market. The bullish rally has been continuous for the last three hours, and the price overcame $0.08836 resistance during this time. As the bullish momentum intensifies, further improvement in DOGE/USD market value is expected as bulls are preparing to challenge the $0.09 resistance next. The buyers must remain persistent to achieve their next aim. The Digital asset also has a market cap of $835 million and a trading volume of $37 million over the last 24 hours.
Dogecoin price analysis 1-day price chart: DOGE touches $0.08665, gaining 1.57 percent
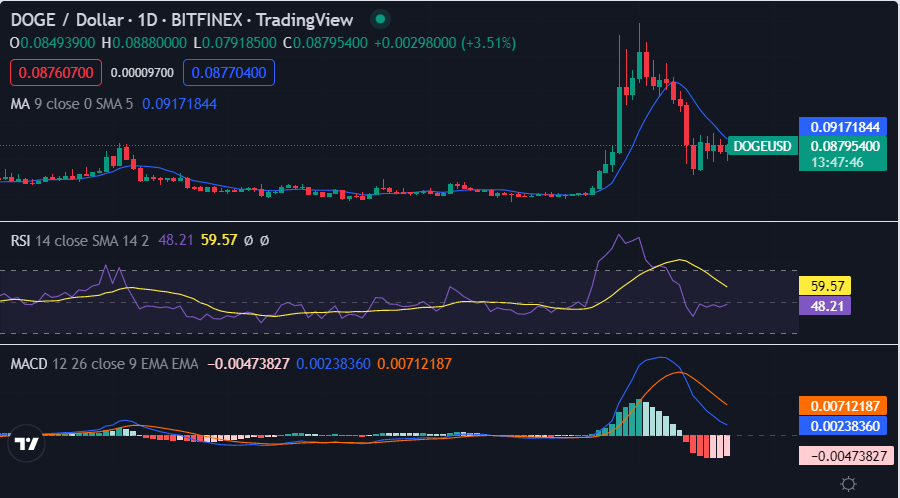
The daily Dogecoin price analysis is in favor of cryptocurrency buyers, as the coin value is enhanced during the day. The price underwent a significant improvement as the bulls reigned the market. Today, a rise in LINK/USD value was detected again as the increasing trend has taken it up to $0.08665, and has gained 1.57 percent value at the time of writing. The moving average (MA) can be seen at the $0.0917 mark.

The MACD indicator is moving upwards toward the positive territory but also shows some bearish pressure. The RSI index is currently at 59.57, which suggests that the market might be in a neutral zone. As long as DOGE/USD maintains above the $0.08011 support level, there is no reason why it shouldn’t continue its upward march.
Dogecoin price analysis 4-hour price chart: Recent updates
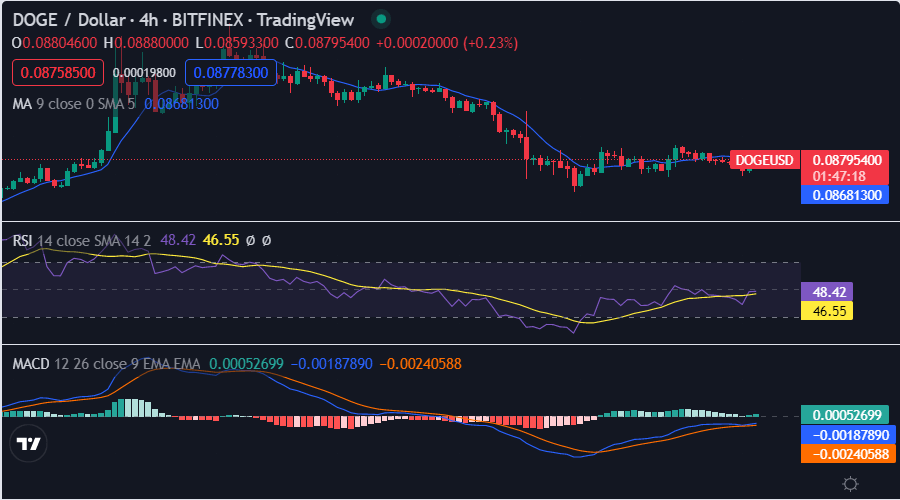
The four-hour Dogecoin price analysis shows an upward trend for the cryptocurrency. Although the price experienced an unexpected fall in the preceding hours, as it started to retrace at the end of the previous trading session and continued correcting till today, currently, the situation is going in support of the buyers as the price has spiked again. The bullish momentum was reinstated in the last four hours as the price finally rejoined the $0.08665 position recovering today’s correction.

The moving average value in the four-hour DOGE/USD price chart stands at $0.08681, which is lower than the previously recorded value of $0.0917. The MACD indicator in the same time frame also shows an improvement, as it has moved further away from its negative region and toward the positive territory as the signal line crosses the MACD line. The RSI index is at 46.55, which shows that there is some bearish pressure but it will ease out very soon as the bullish trend gains traction.
Dogecoin price analysis conclusion
The daily and hourly Dogecoin price analysis is going in favor of the bulls. The buying activity is heightening as a spike in cryptocurrency’s value has been seen again. The bulls are aiming to surpass the $0.08836 resistance, which will soon undergo a test.


