On-chain data shows that Bitcoin miners have continued to sell recently, something that could be bearish for the cryptocurrency’s price.
Bitcoin Miners Have Been Shedding Their Reserves Recently
As pointed out by an analyst in a CryptoQuant post, there has been some intense pressure from miners in recent days. The relevant indicator here is the “miner reserve,” which measures the total amount of Bitcoin that’s currently sitting in the wallets of all miners.
When the value of this metric goes up, it means the miners are depositing a net amount of coins into their addresses right now. Such a trend can be a sign that these chain validators are accumulating currently, and hence, can have bullish consequences for the asset’s value.
On the other hand, the indicator’s value going down implies that these investors are transferring some BTC out of their wallets at the moment. As the miners generally only withdraw their coins whenever they want to sell them, this kind of trend can be bearish for the price of the cryptocurrency.
Now, in the context of the current discussion, the actual metric of interest is the 14-day rate of change (ROC) of the Bitcoin miner reserve, which tells us about the pace at which the indicator is registering fluctuations, as well as the direction these fluctuations are in (negative or positive).
Here is a chart that shows the trend in the 14-day ROC BTC miner reserves over the last few months:

Looks like the value of the metric has been quite red in recent days | Source: CryptoQuant
As shown in the above graph, the 14-day ROC of the Bitcoin miner reserve has had a negative value during the last few days. This means that the holdings of these chain validators have been decreasing in this period.
Not too long ago, though, the indicator had some positive values, implying that these chain validators had been buying. Things changed once the asset’s price started to slip below the $30,000 level, however.
When the price hit around $28,000, the turn towards red values came for the indicator, implying that the miners may have possibly joined in on the market-wide selloff.
Following the selling spree from the miners, the asset’s value continued its decline and dropped all the way to the low $26,000 level. Since then, however, the decline has stopped, possibly suggesting that those levels may have offered the local bottom for the asset.
The selling pressure from the miners has also started slowing down recently, as the latest negative spike of the metric has been lesser in scale than the previous ones, which can be seen in the chart.
During the past day, the asset’s price has also bounced back above the $27,000 level again, implying that the market may now be able to absorb the current levels of selling pressure from this cohort.
This kind of trend had also been seen during the selloff back in March, where the price formed a bottom and then rebounded up as the selling pressure died out from the miners.
It now remains to be seen whether the miners will decrease their selling in the next few days (like back in March), or if they will continue to sell, possibly causing more bearish price action for the asset.
BTC Price
At the time of writing, Bitcoin is trading around $27,300, down 2% in the last week.
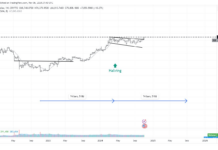
BTC has shot up during the past day | Source: BTCUSD on TradingView
Featured image from iStock.com, charts from TradingView.com, CryptoQuant.com


