


The Bitcoin price may be on the verge of hitting new all-time highs as a crypto analyst has unveiled the emergence of a new technical indicator called the “Bird Beak Sign.” Spotted on the Bitcoin Heikin Ashi chart, the analyst suggests that this technical pattern indicates a potential price rally is imminent.
‘Bird Beak’ Pattern Signals Path To $100,000
Optimism in the crypto community is soaring as a popular crypto analyst, ‘Trader Tardigrade’ has shared a bullish prediction for Bitcoin’s price outlook. In an X (formerly Twitter) post, the analyst uncovered a distinct technical pattern known as the “Bird Beak sign” in the Bitcoin Heikin AshiBitcoin Heikin Ashi chart, which is a type of candlestick chart used to spot market trend direction and predict future prices.
Related Reading
The Bird Beak Sign is a distinct chart pattern that resembles a beak and is created when the Heikin Ashi candlesticks cluster together in a tight consolidated range. Typically when a cryptocurrency consolidates, it means that its price is stabilizing before a potential rally upwards. In the case of Bitcoin, the recent Bird Beak pattern suggests consolidation is preceding an upward momentum.
The analyst notes that in the past when Bitcoin showed the Bird Beak sign on the daily Heikin Ashi chart, it was followed by a strong uptrend. This upward movement was represented by multiple green candles, which showed upward movement.
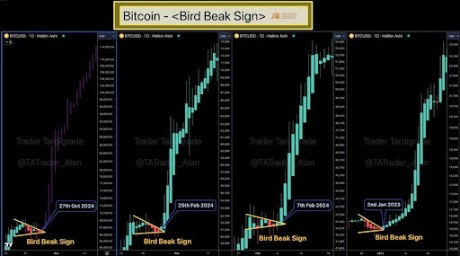
Sharing a price chart, Trader Tardigrade disclosed that on 2nd January 2023, a Bird Beak sign had appeared in the Bitcoin chart, triggering a price surge to $23,250 at the time. This same chart pattern was also observed on the 7th and 25th of February, 2024, with Bitcoin skyrocketing to $52,000 and reaching between $71,000 to $72,000, respectively.
Trader Tardigrade has revealed that the present Bird Beak sign seen in Bitcoin’s Heikin Ashi chart formed on 27 October 2024. Based on these past signs, analysts have predicted that the new Bird Beak pattern could lead to another sharp increase for Bitcoin, potentially pushing its price to $114,000 this month.
Analyst Expects Bitcoin Price To Hit $71,000 First
In a more recent X post, Trader Tardigrade revealed that Bitcoin was breaking out of a Symmetrical Triangle at the tip of its 8-hour Heikin Ashi chart. Based on this new symmetrical triangle pattern, the analyst forecasts that a successful breakout could lead to a rally towards the $71,000 price target for Bitcoin.
Related Reading

This bullish sentiment is shared by another popular analyst known as the ‘Titan of Crypto,’ who also projects Bitcoin’s next target at $71,000. This analyst has predicted that Bitcoin will reach this new target before the month closes, highlighting that the cryptocurrency’s monthly candle is looking significantly strong.
It’s important to note that as of writing, the price of Bitcoin is trading at $67,856, marking a 1.3% increase in the past 24 hours, according to CoinMarketCap.
Featured image created with Dall.E, chart from Tradingview.com


