


- Cardano price has been consolidating in a descending triangle pattern for nearly ten days.
- A breakout from this setup forecasts a 16% move, potentially to the upside.
- If ADA produces a decisive close below $1.20, it will invalidate the bullish thesis.
Cardano price has been consolidating above a crucial level by producing roughly equal lows and lower highs, giving rise to a generally bearish pattern. However, due to its location at a critical demand zone, ADA has a chance at a bullish breakout.
Cardano price eyes higher highs
Cardano price set up three lower highs and roughly two equal lows around $1.20 since December 7. Connecting these swing points using trend lines result in a descending triangle. This technical formation usually resolves to the downside and is considered a bearish pattern. However, Cardano price has formed this consolidation pattern just above a daily demand zone, extending from $1.02 to $1.19. Therefore, the chances of ADA heading lower are low.
Regardless, this setup forecasts a 16% breakout to $1.51, determined by adding the distance between the first swing high and swing low to the breakout point. Assuming a bullish outlook, ADA needs to produce a four-hour candlestick close above the triangle’s hypotenuse at $1.30 to trigger a bull rally.
During this ascent, Cardano price will face the $1.45 hurdle that needs to be overcome for the bulls to hit their target at $1.51.
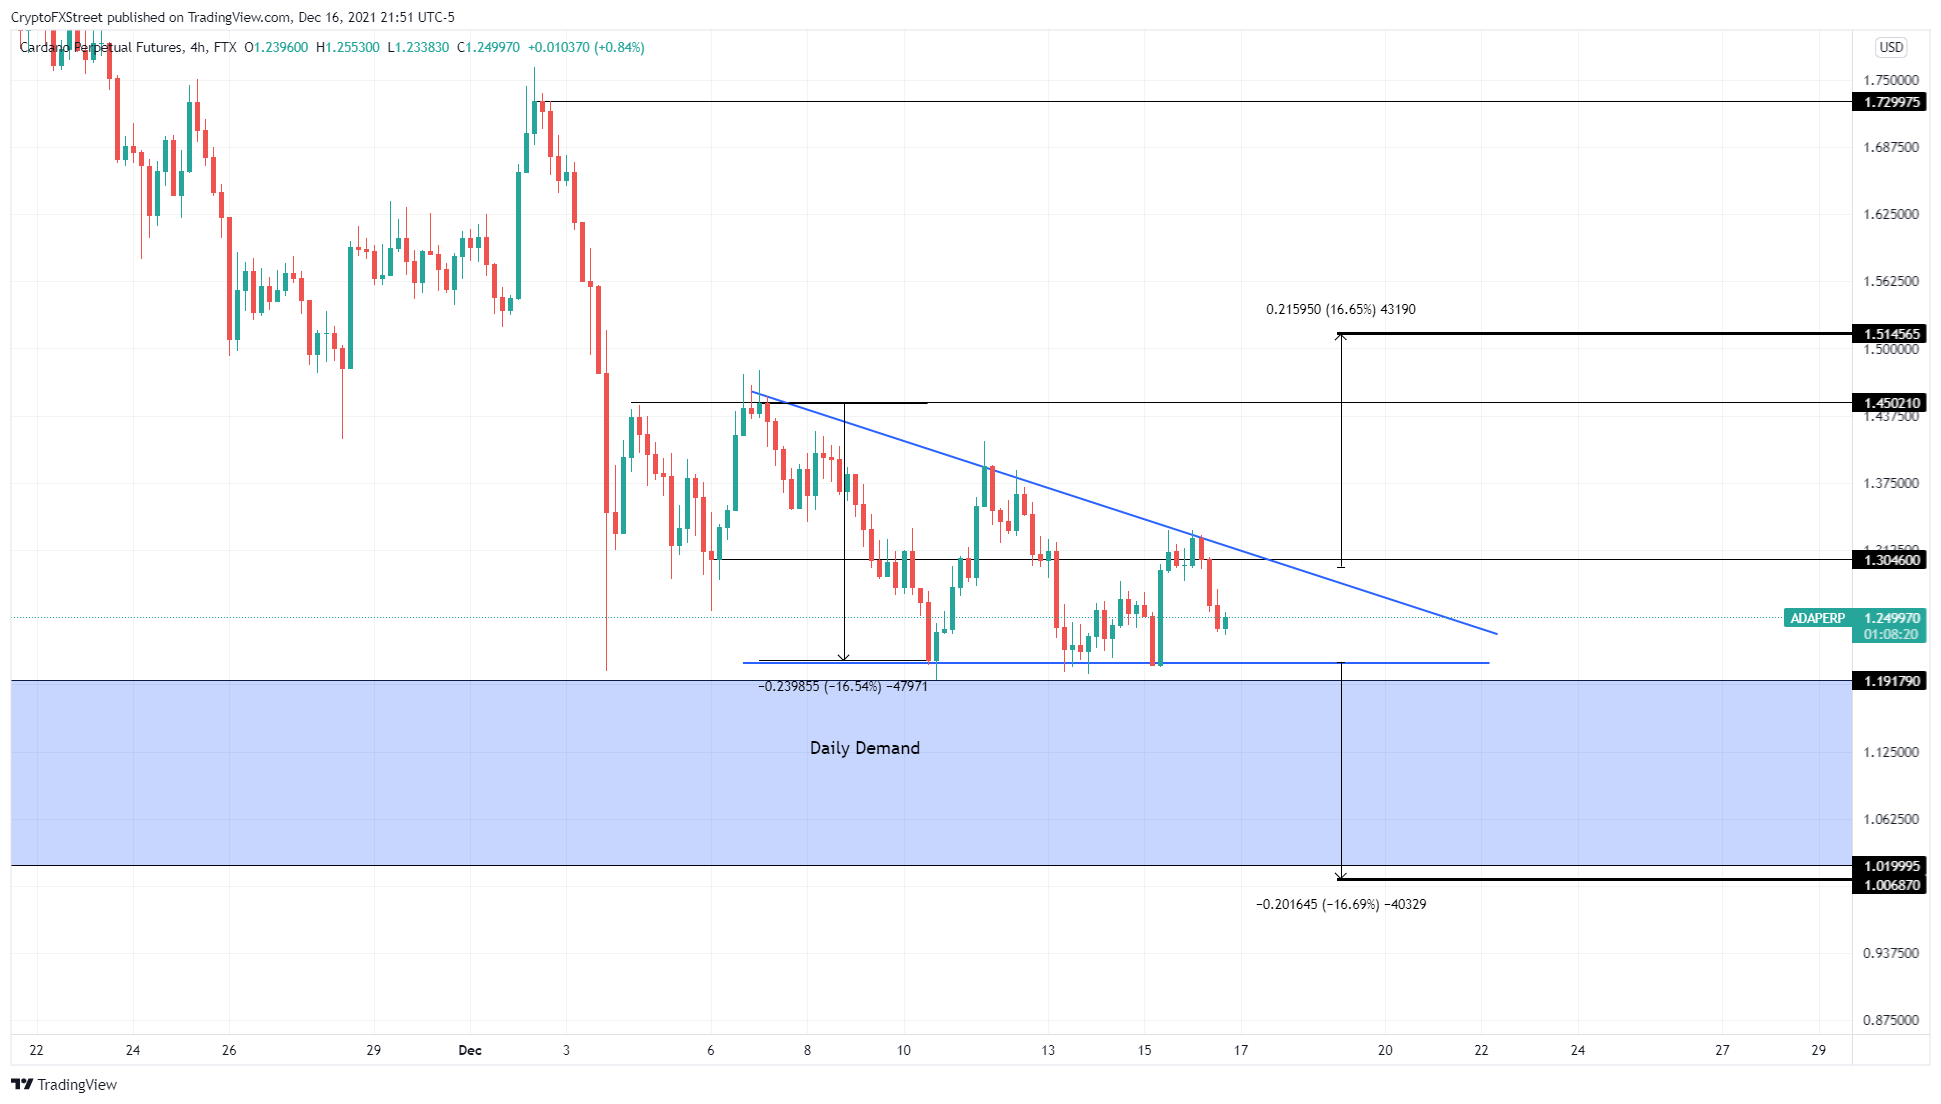
ADA/USDT 4-hour chart
Although unlikely, if Cardano price produces a four-hour candlestick close below the triangle’s base at $1.20, it will signal a bearish breakout. In this case, the descending triangle forecasts a 16% downswing to $1.00. For this outcome to play out, ADA bears need to slice through the massive demand zone first, extending from $1.02 to $1.19.
 – CryptoPotato")


