- Cardano added a new badge to milestones recently achieved
- ADA’s price, in a conventional manner, acted oblivious of the incident
Native assets on the Cardano [ADA] chain surpassed seven million, the network’s real-time information portal, Adaverse, reported. According to the trusted Cardano data provider, the Proof-of-Stake (PoS) actually crossed the 7.2 million mark.
Interestingly, this came after Cardano wallets hit a jaw-dropping landmark.
JUST IN: Cardano $ADA network surpasses 7.2 million native assets.
— Adaverse News | Cardano and Ergo News (@AdaverseNews) December 10, 2022
Read Cardano’s [ADA] Price Prediction 2023-24
In a follow-up update, Adverse tweeted that the network was able to surpass 66,000 transactions in the last 24 hours. However, it has become common for ADA to hit certain climaxes without turning them into positive price action.
This latest one was also not divergent as compared to the former responses.
JUST IN: Cardano $ADA network completes 66,000 transactions in the last 24 hours.
— Adaverse News | Cardano and Ergo News (@AdaverseNews) December 10, 2022
No days off
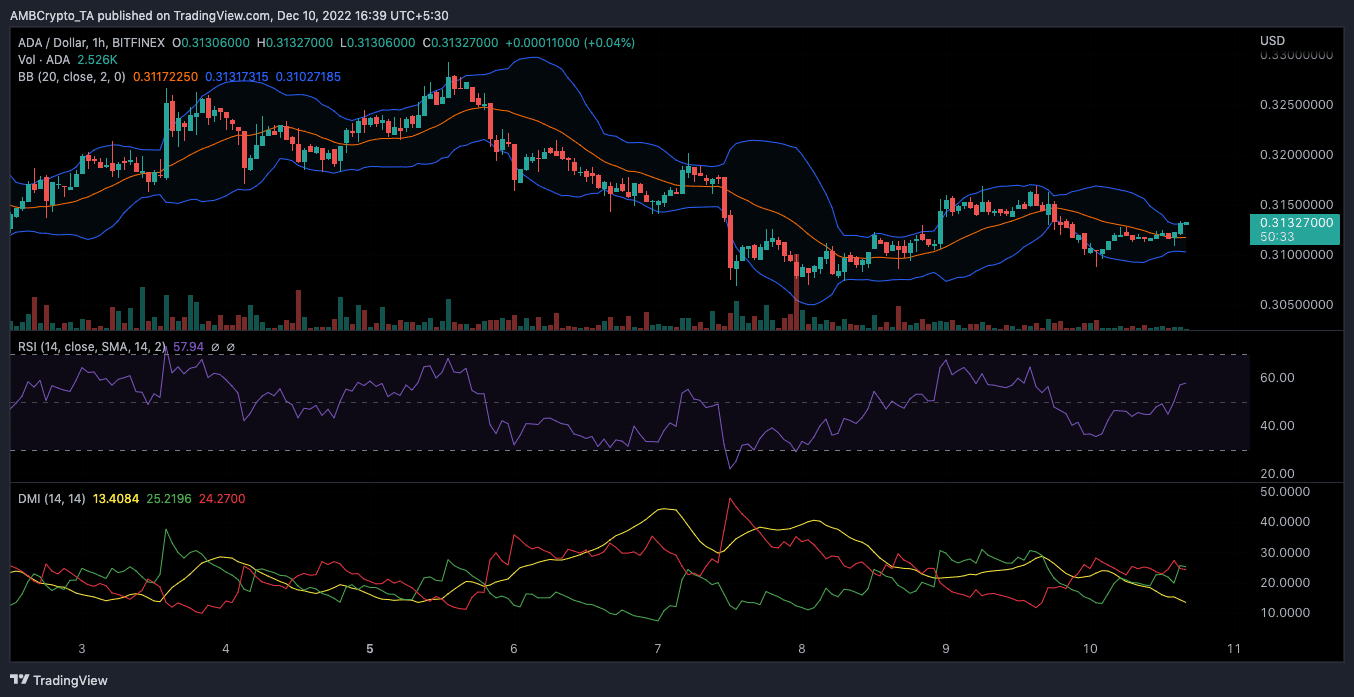
Based on data from CoinMarketCap, these two landmarks had only driven ADA to a 0.74% value decrease in the last 24 hours. Therefore, building up on its 4.05% weekly shredding. Per its price action, the Bollinger Bands (BB) showed that ADA retired its recent volatility hike.
Since it exhibited contraction, ADA might continue languishing in its tight trading pattern around $0.31. Additionally, its price touching the upper band level meant that ADA reached an oversold level. This implied a prospect for a further price drop.
Indications from the Relative Strength Index (RSI) also seemed to align with the BB signals. At the time of writing, the RSI was 57.94, as seen in the chart above. However, the trend displayed by the indicator showed that it was heading toward the overbought region. If attained up to 70, then a strong price reversal would be the case.
ADA showed indecisiveness in terms of its Directional Movement Index (DMI). This was because neither buyers nor sellers had a solid edge over each other. On assessing the movement, the positive DMI (green) was 25.21. For the negative DMI (red), it was 24.27.
With such a close distance, the Average Directional Index (ADX) in yellow exempted itself from supporting any solid directional movement. Hence, ADA’s price chances were locked in the $0.3 region consolidation.
It’s still a chance, nevertheless
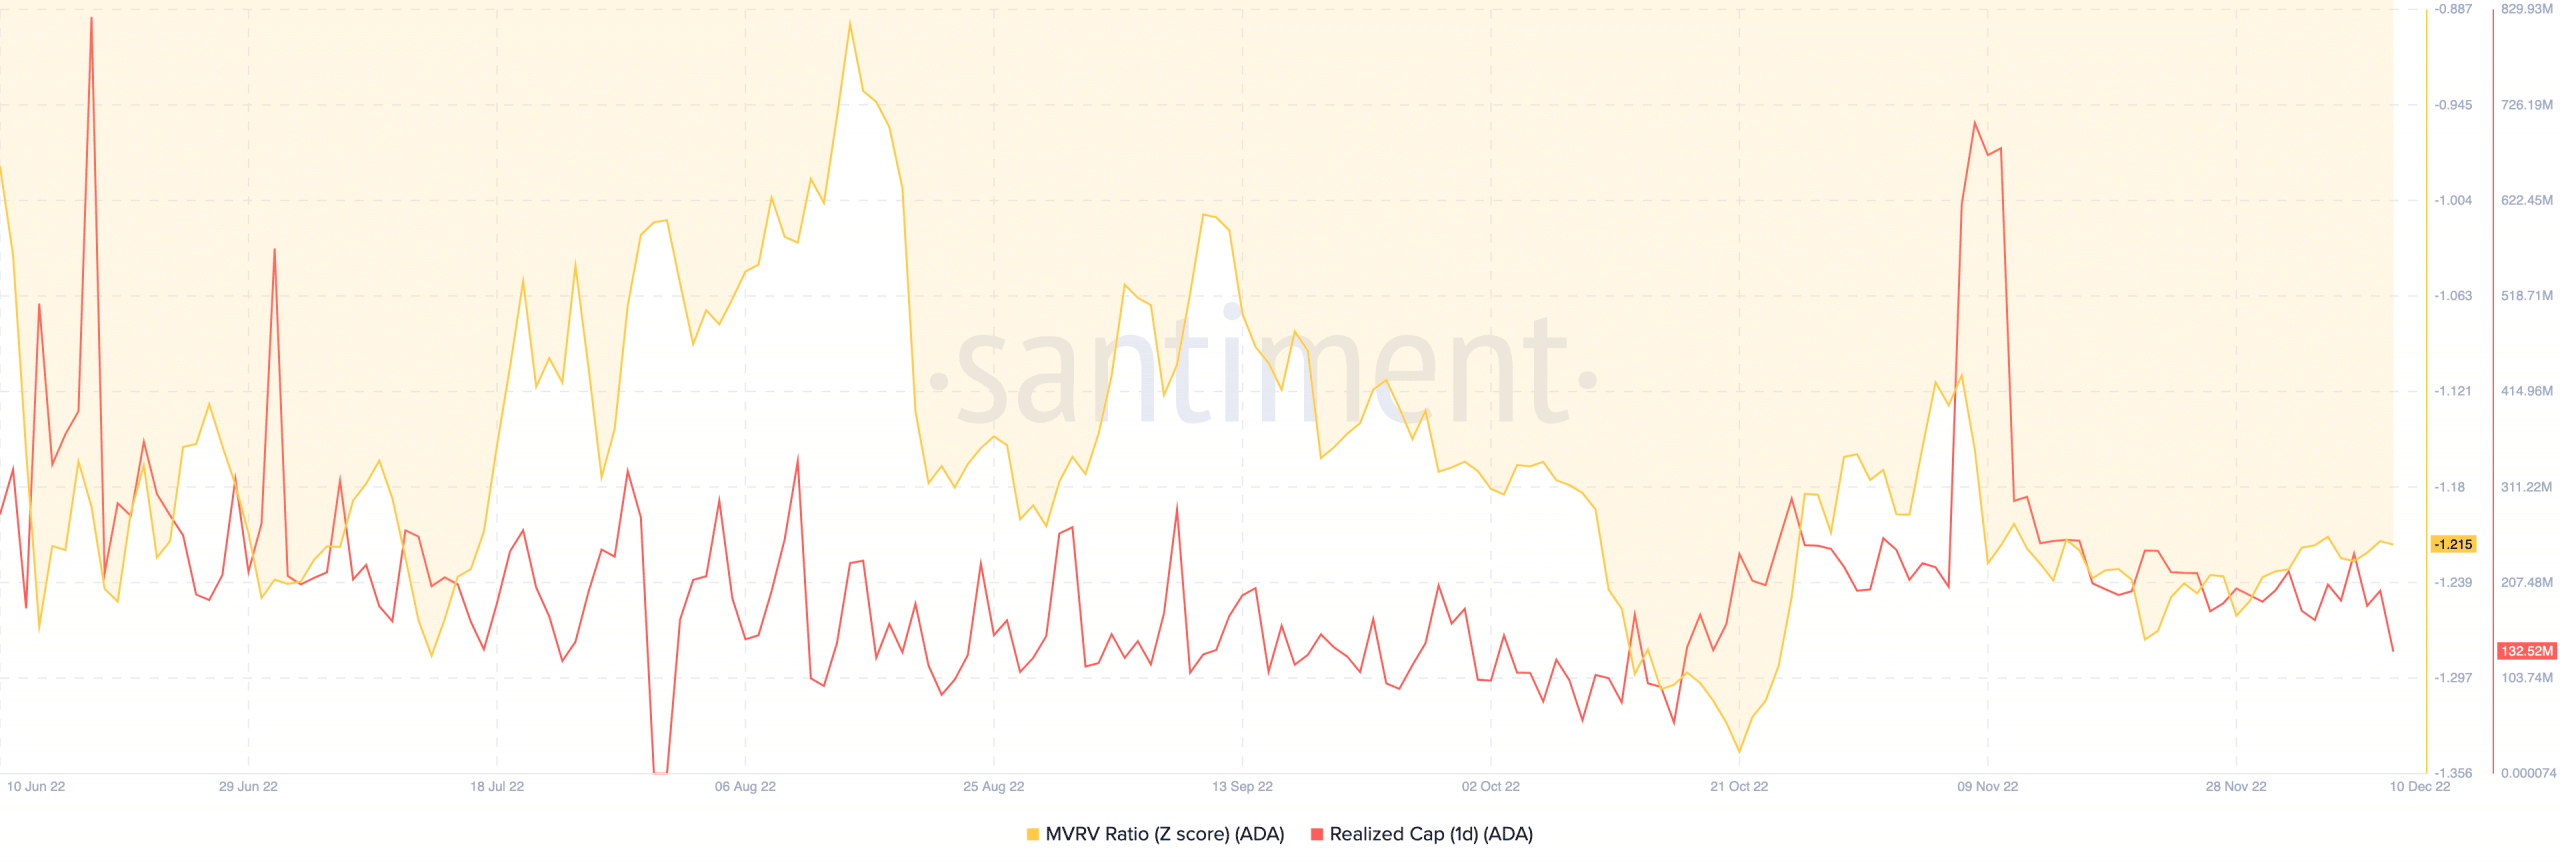
As ADA was not demanding a stretch to $0.4, as the Market Value to Realized Value (MVRV) z-score showed that ADA could have been more valued. This assertion was due to the MVRV z-score increasing to 1.215. Although a massive decline from its point on 7 November, it expressed signs that ADA was only at a fair value.
For its one-day realized capitalization, Santiment showed that ADA had fallen off the cliff. This meant ADA holders spent more to acquire the tokens on average than the value currently assigned. Hence, this primarily resulted in losses for investors who had held for the long term.


