In the past 48 hours, the price of XRP has experienced notable volatility, dropping below $0.50. The crypto market is closely focused on XRP due to a recent favorable development in the Securities and Exchange Commission (SEC) vs. Ripple lawsuit.
The emergence of the Hinman documents has sparked inquiries into the actions of the Securities and Exchange Commission. Although XRP witnessed positive price action earlier this year, the altcoin has faced challenges due to ongoing market volatility. This has led to a break below significant support levels.
Over the last 24 hours, XRP has seen a close to 7% dip. There has been an 8% depreciation on the weekly chart. Both the demand and accumulation of the asset have remained low. This indicated a dominant bearish trend. The fear index remains high in the market, contributing to a decline in investor confidence.
Failure to surpass the $0.50 level may result in a significant loss of value for XRP during the next trading session. Furthermore, the decrease in the altcoin’s market capitalization reinforces the weak buying power reflected on the chart.
XRP Price Analysis: One-Day Chart

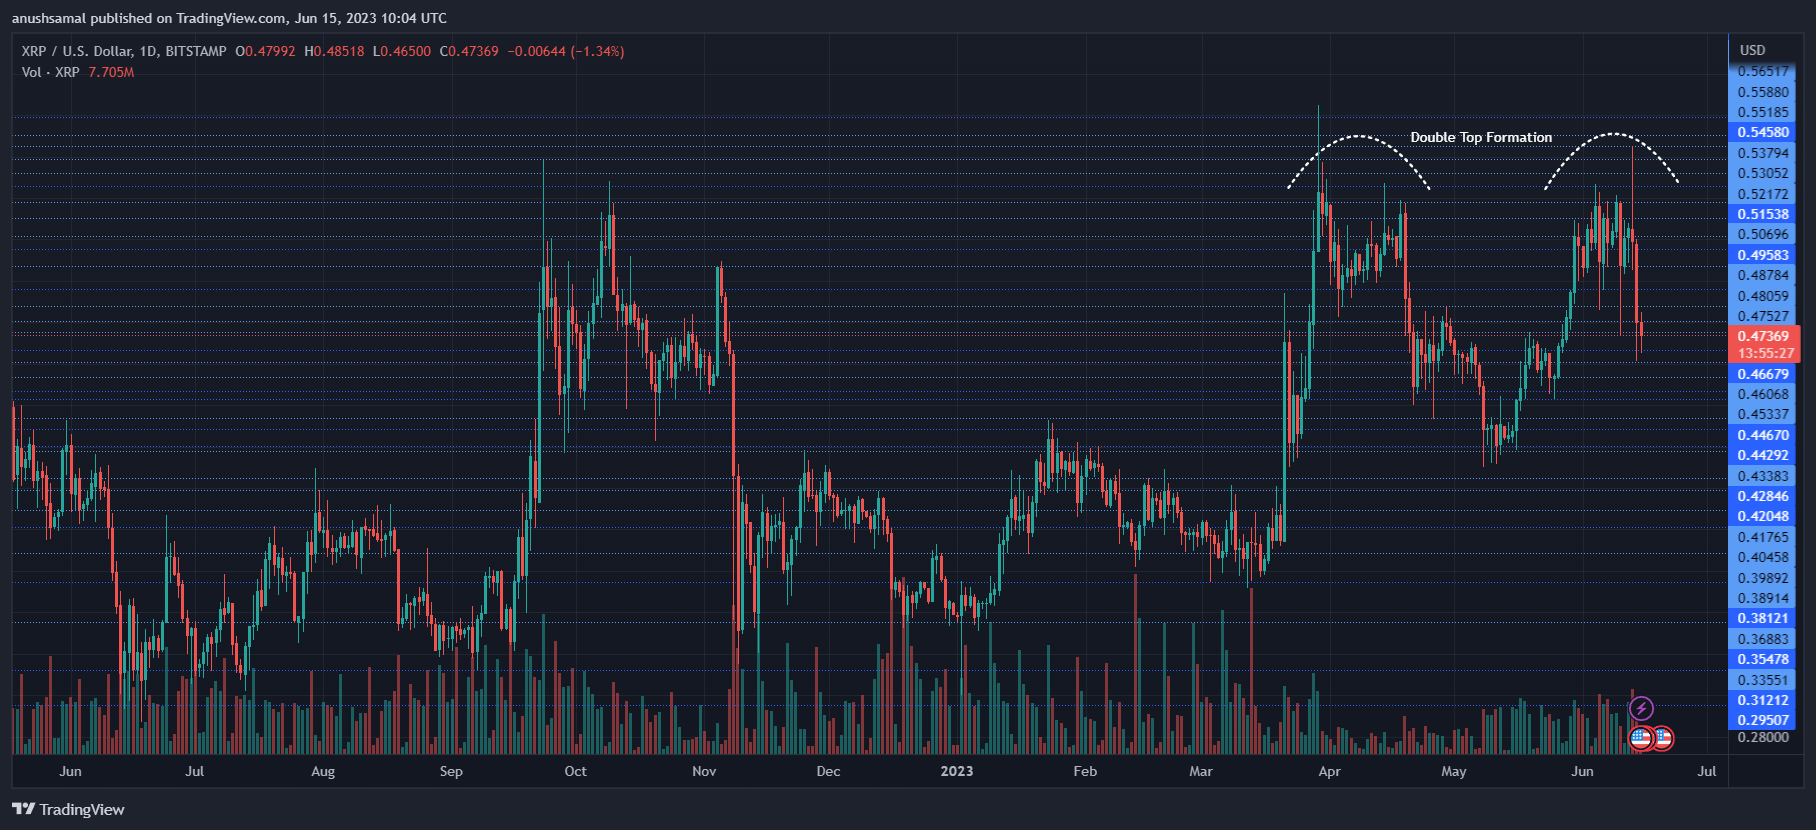
As of the time of writing, the altcoin XRP was trading at $0.47. Following the rejection of the bulls at $0.50, XRP has been experiencing a downward trend.
The coin faced resistance at $0.50, and it is anticipated that it may encounter even stronger resistance at $0.55. If the altcoin fails to surpass the $0.55 mark, it will likely dip to its local support level of $0.46 and potentially further down to $0.43.
Moreover, the altcoin has formed a bearish double-top pattern, indicating a potential reversal in its price trend as it moves downward on the chart. The trading volume of XRP has also declined in the last session, suggesting that sellers have taken control of the asset.
Technical Analysis

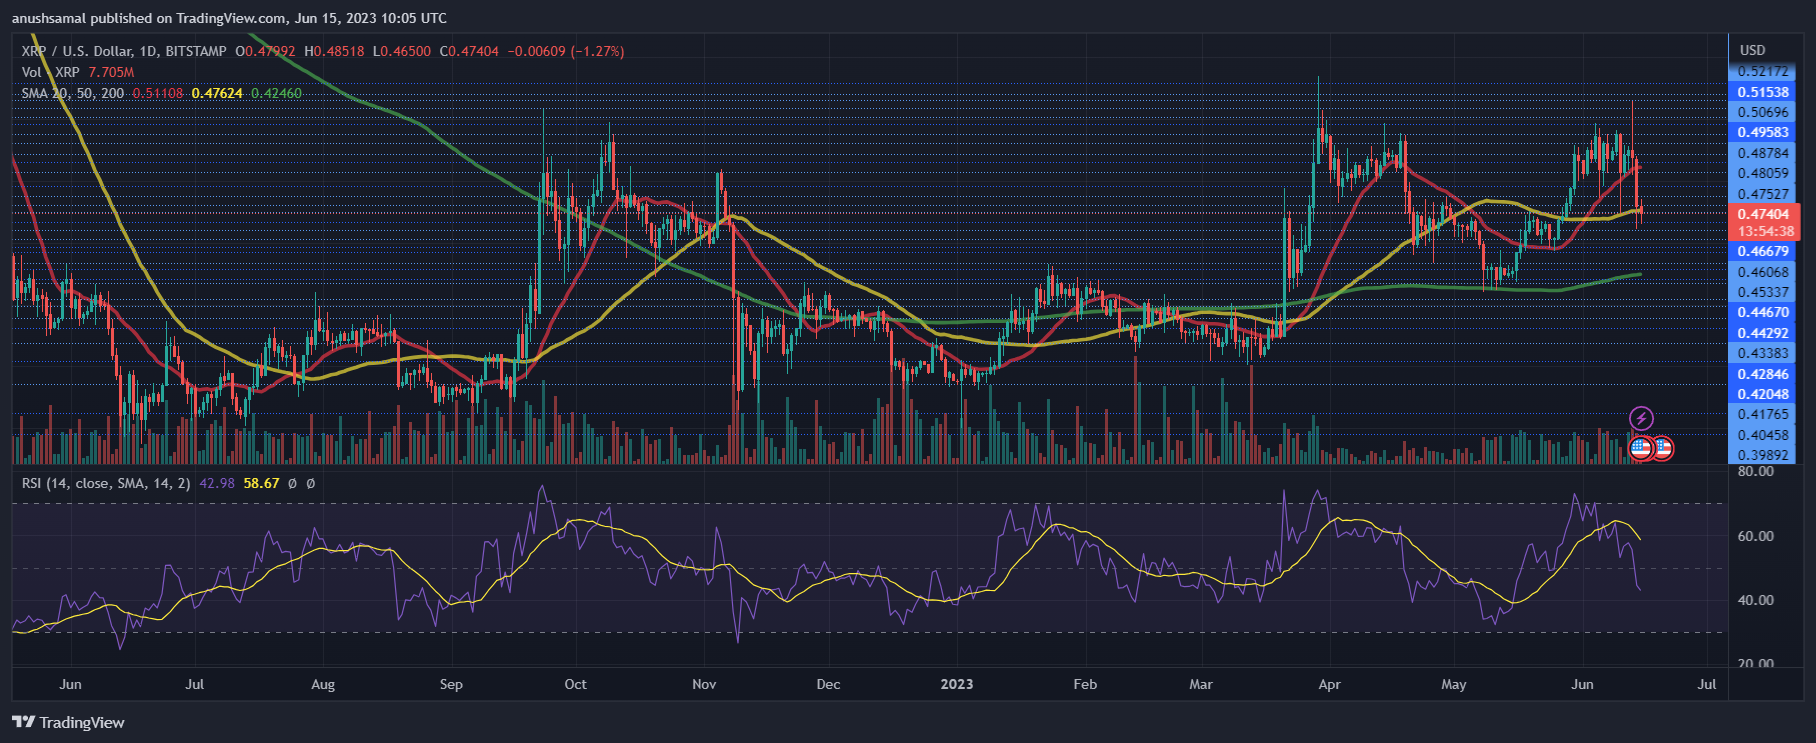
During the majority of this month, XRP witnessed a decline in demand. This was reflected by the Relative Strength Index (RSI) falling below the half-line, indicating that sellers had taken control of the asset.
Additionally, XRP fell below the 20-Simple Moving Average (SMA), suggesting low demand and indicating that sellers were driving the price momentum in the market.
However, if the altcoin trades near the $0.50 price mark, it can potentially bring the price back above the 20-SMA line. This would essentially indicate a resurgence in demand for the asset.

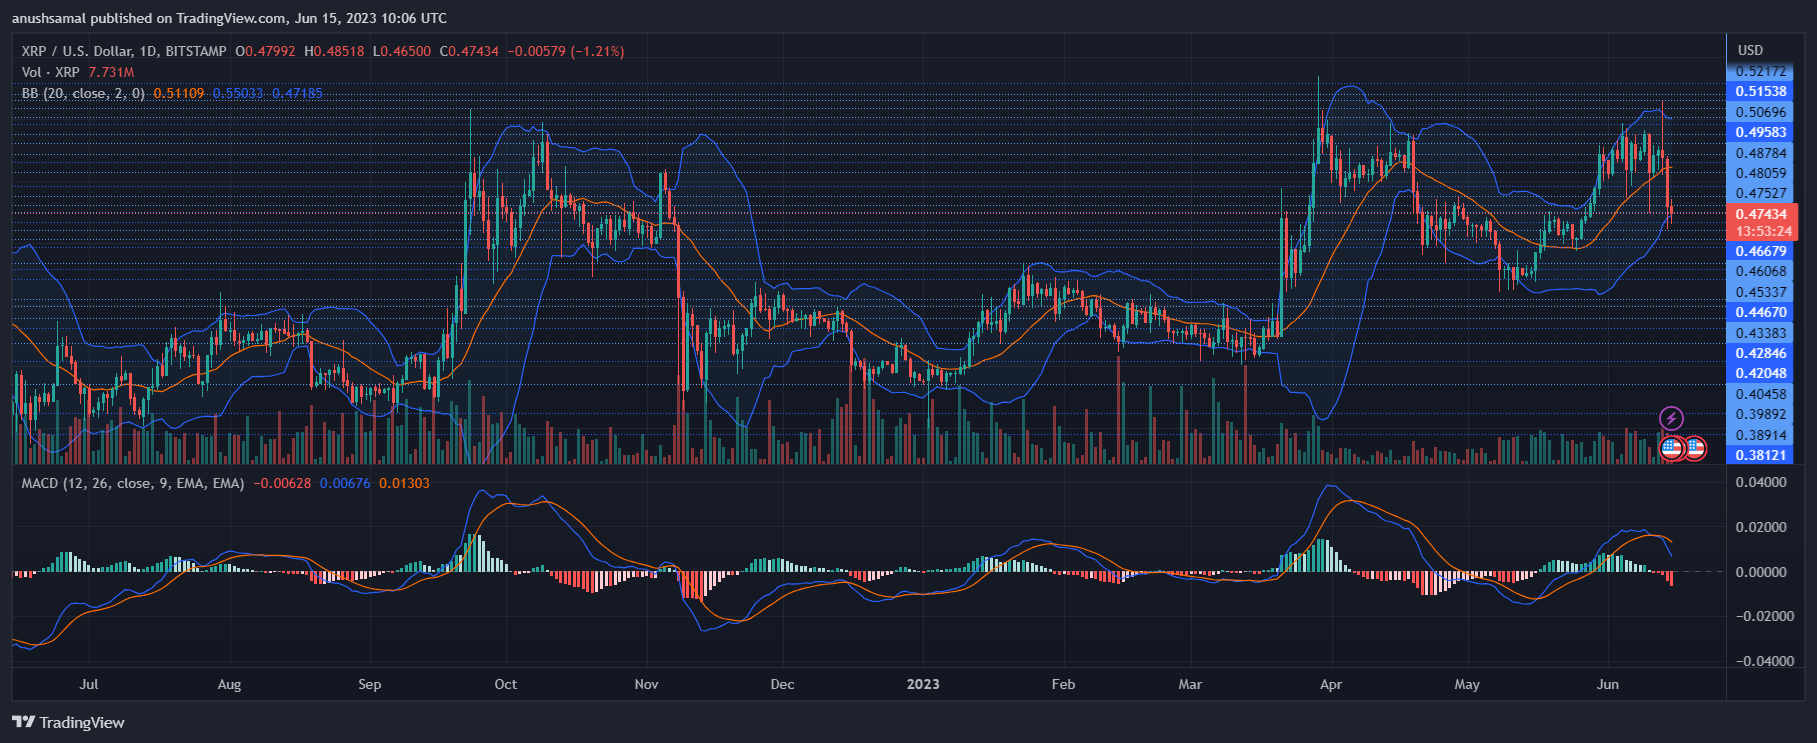
In addition to the mentioned technical indicators, other signals on the chart for the altcoin indicate selling pressure. The Moving Average Convergence Divergence (MACD) formed red histograms, signalling sell signals for the altcoin and indicating a bearish sentiment in the market.
Related Reading: Ethereum Bears Set Their Sights On Next Downside Target If $1,700 Support Breaks
Furthermore, the Bollinger Bands have widened, indicating increased volatility and potential price fluctuations for the altcoin in the upcoming trading sessions. This suggests that the price of XRP may experience significant changes and unpredictability in the near term.
Featured Image From UnSplash, Charts From TradingView.com


