- Bitcoin price steadies the run from support at $29,000 by settling above $32,000.
- Polkadot leads recovery in the market alongside crypto assets like Stellar.
The cryptocurrency boat has slowed down following a remarkable recovery from the slump earlier in the week. As crypto assets came up gasping for air, the hope for recovery blossomed among investors. Bitcoin stepped above $32,000, although it failed to break the barrier at $33,000.
On the other hand, Ethereum recoiled from levels close to $1,700 and is currently settled slightly above $2,000. The cross-border money transfer token XRP lifted from $0.52 to ballet the barrier at $0.6 before extending the price to $0.7 and $1, respectively.
Bitcoin:-
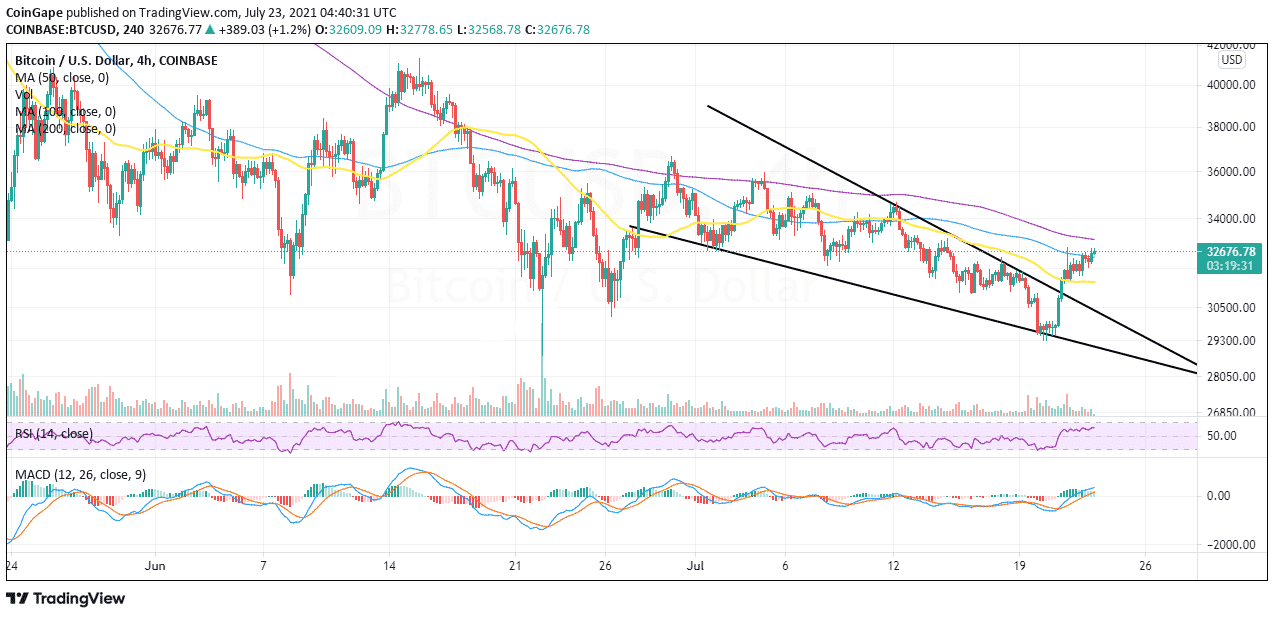
Bitcoin is closing in the stubborn resistance at $33,000 after firmly securing support at $32,000. Short-term technical indicators suggest the flagship cryptocurrency is in the bulls’ hands. Moreover, overcoming the hurdle at the 100 Simple Moving Average (SMA0 seems to have triggered more buy orders as bulls focus on lifting to $34,000 in the coming sessions.
The Moving Average Convergence Divergence (MACD) indicator bullish impulse confirms the ongoing uptrend. In addition to the recently flashed buy signal, the MACD has crossed above the mean line, thus adding credence to the bullish outlook. Therefore, Bitcoin can gain ground above $33,000 and perhaps close the day beyond $34,000.
BTC/USD four-hour chart

Polkadot:-
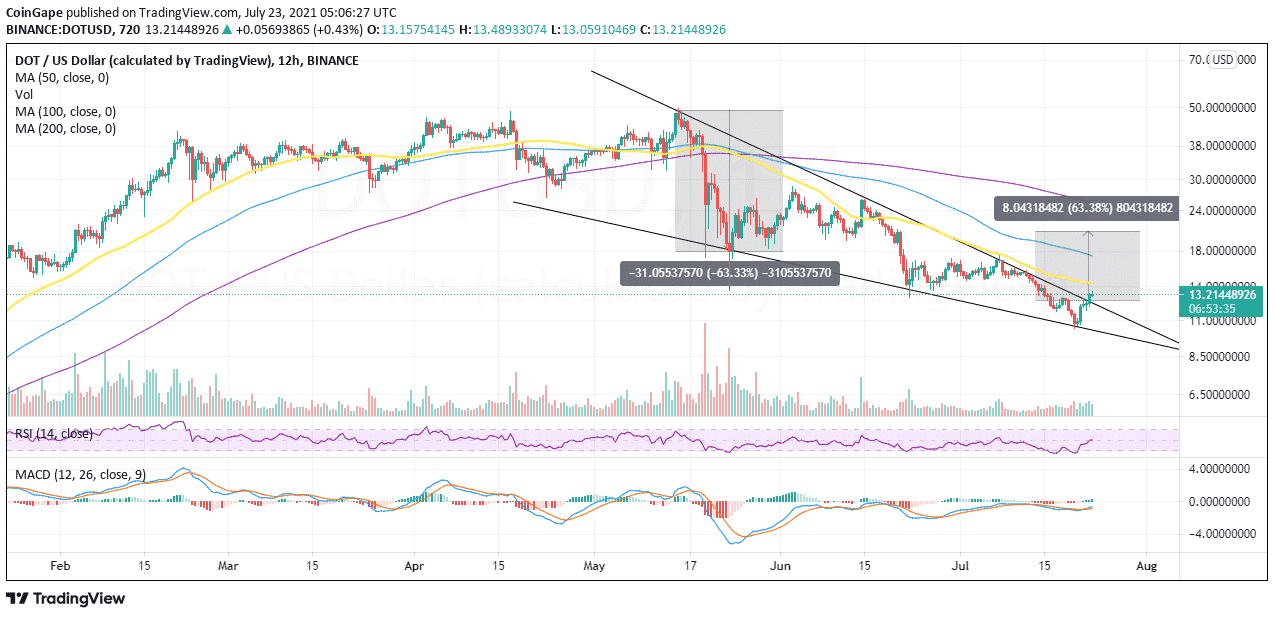
Polkadot has begun a potentially huge run for gains eyeing highs above $20. The bullish outlook comes after the toke plunged to $10.5. A recovery is underway with, bulls gaining ground above $13.
Consequently, the bullish outlook has been reinforced by a falling wedge pattern. Traders use this pattern to identity trend correction and ascertain the validity of the asset gaining ground, especially after a significant price drop.
A real break above the upper trend line confirms the breakout. An upsurge in volume usually accompanies it. As for Polkadot, the uptrend could hit levels above $20 after extending the bullish leg 63% from the breakout point.
DOT/USD four-hour chart

The MACD also reinforced the bullish narrative by presenting a call to buy Polkadot on the four-hour chart. Meanwhile, the bulls’ strength is emphasized by the RSI’s movement from the oversold area to above the midline.
Disclaimer
The presented content may include the personal opinion of the author and is subject to market condition. Do your market research before investing in cryptocurrencies. The author or the publication does not hold any responsibility for your personal financial loss.


