


ADA/USD – ADA Trades Inside Ascending Price Channel
Key Support Levels: $1.23, $1.18, $1.12.
Key Resistance Levels: $1.30 – $1.32, $1.40, $1.45.
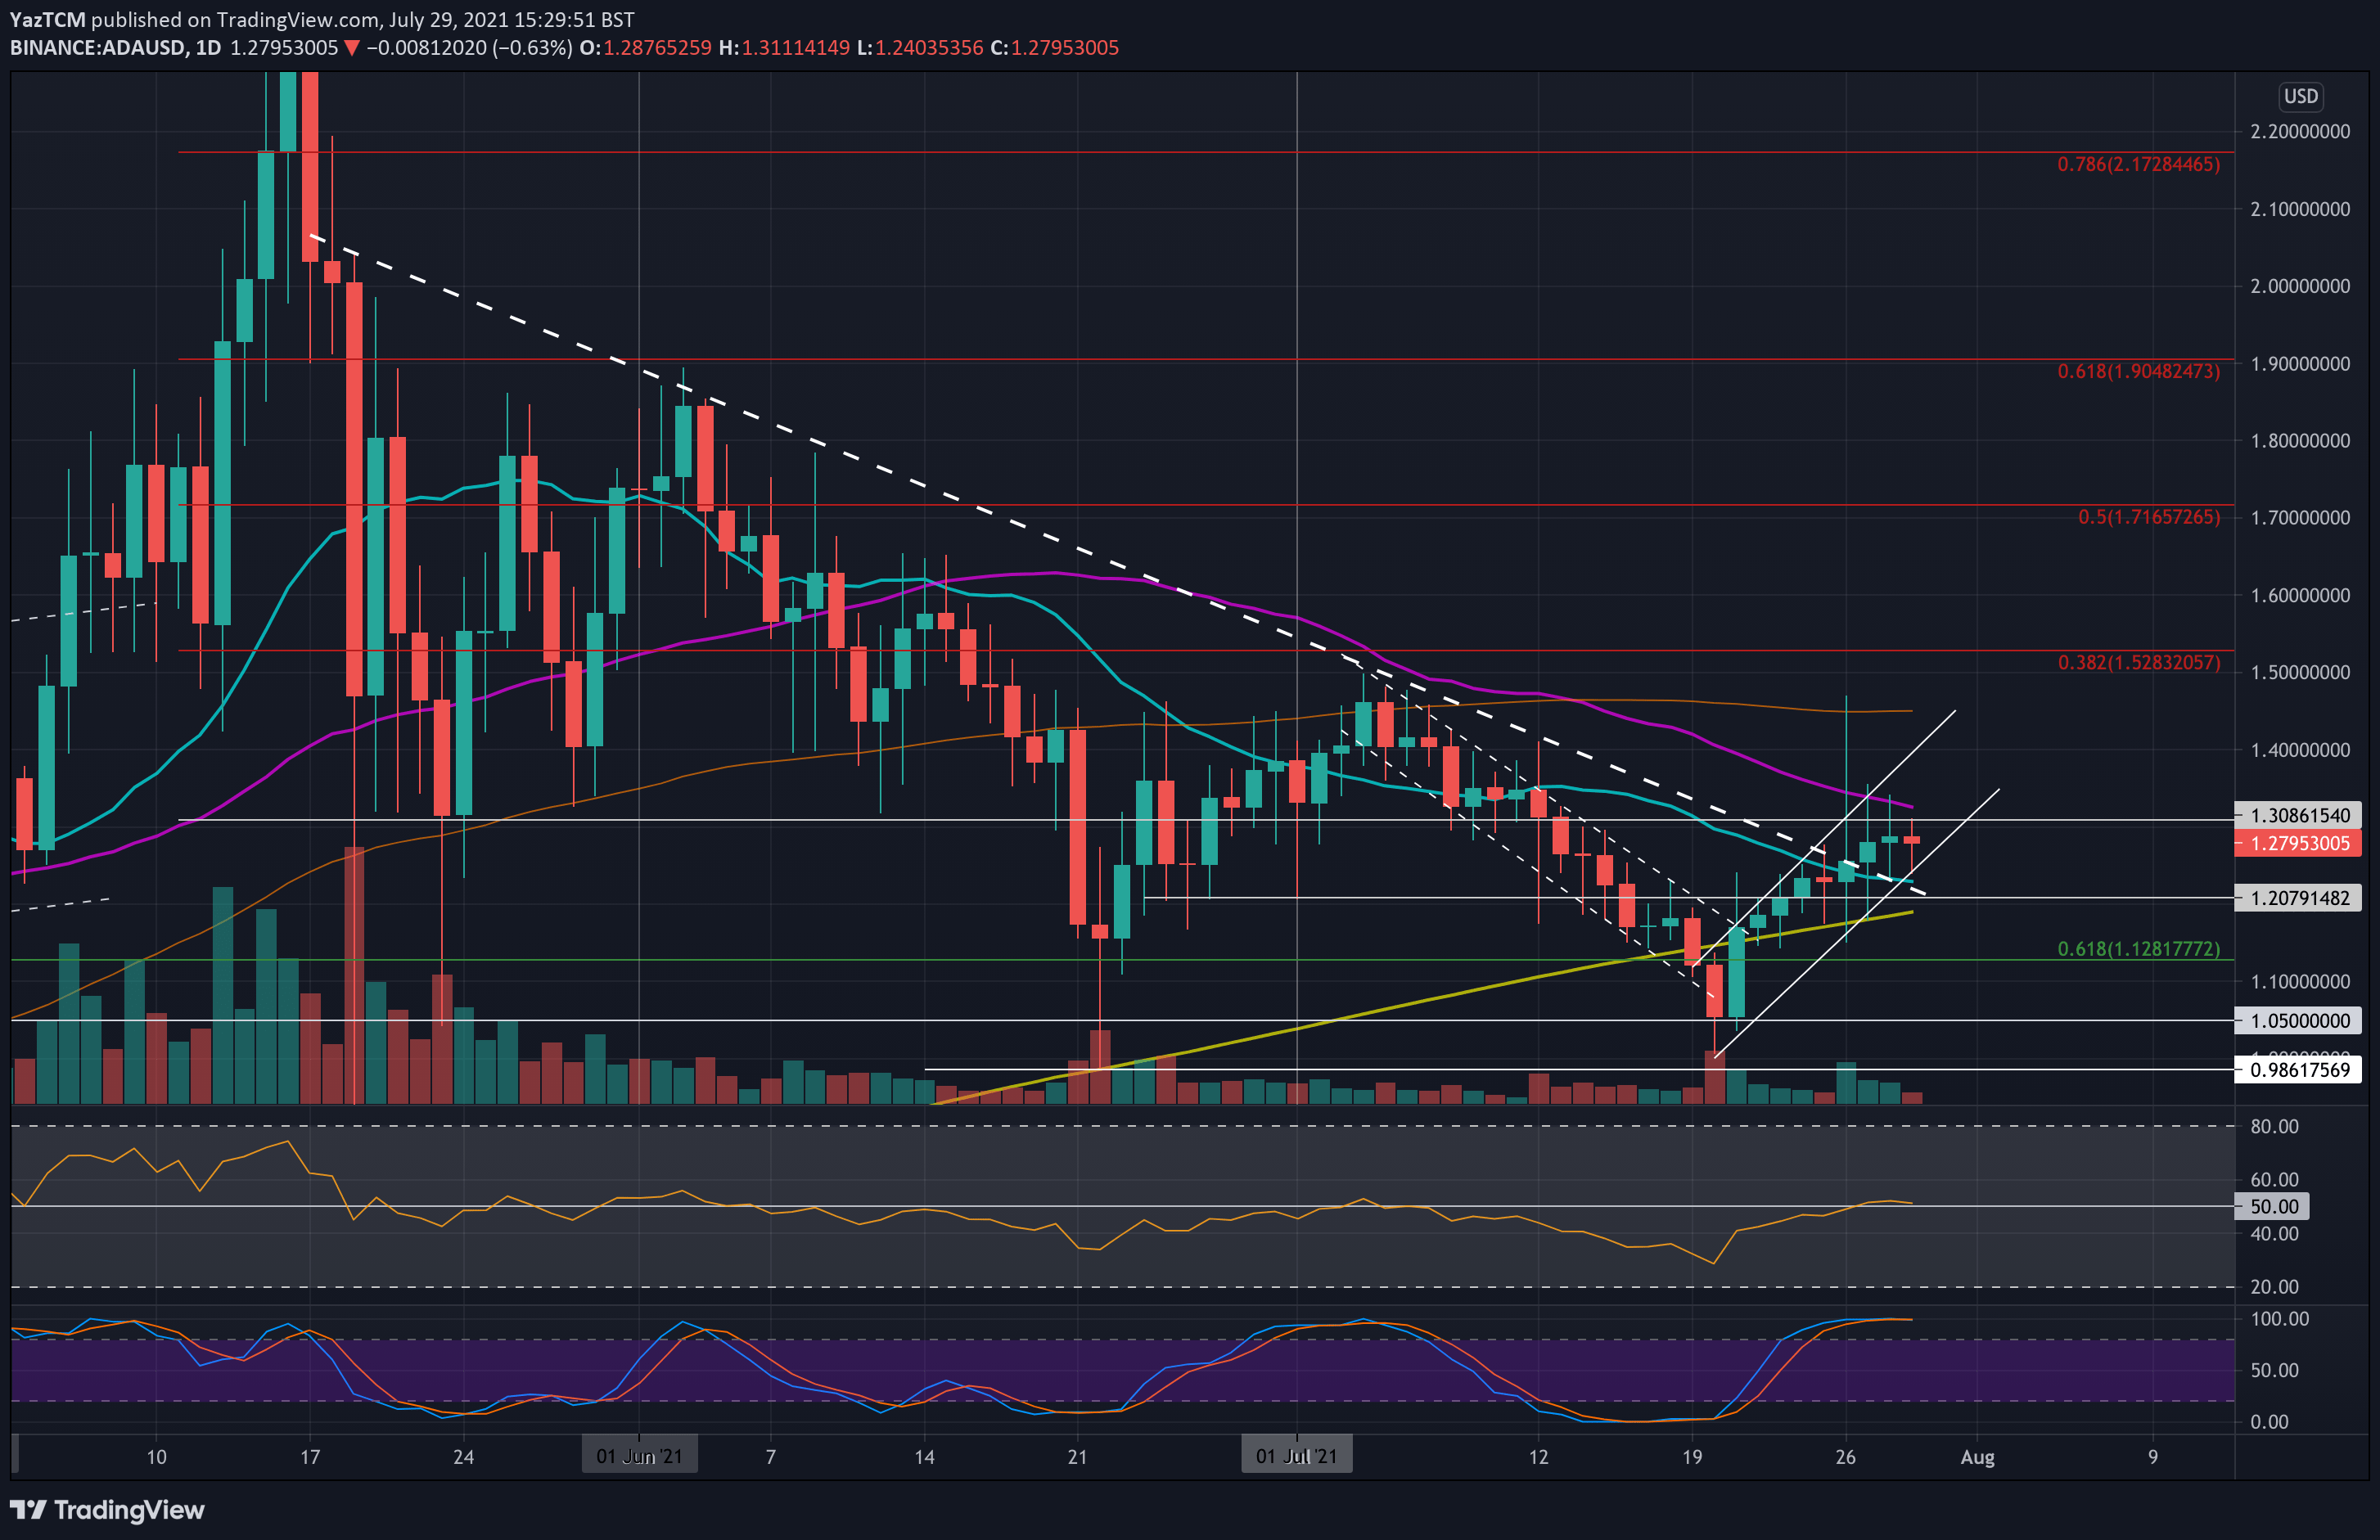
ADA is up 22% since rebounding from support at $1.05 nine days ago. From there, the cryptocurrency established an ascending price channel as it broke above the 200-day MA and the 2-day MA.
ADA is now struggling to close above the $1.30 resistance and uses the lower angle of the ascending price channel as support. $1.30 provided strong support at the beginning of July and, therefore, is providing strong resistance right now.
If $1.30 is penetrated, ADA is likely to drive higher inside the price channel on the way up toward $1.50.
ADA-USD Short Term Price Prediction
Looking ahead, the first resistance lies at $1.30. The 50-day MA sits marginally above $1.30 at $1.32. Above this, resistance lies at $1.40 (upper angle of the price channel), $1.45 (100-day MA), and $1.50 (bearish .382 Fib).
On the other side, the first support lies at $1.23 (lower angle of price channel 20-day MA). Beneath this, support lies at $1.18 (200-day MA), $1.12 (.618 Fib), and $1.05.
The daily RSI is at the midline as indecision looms within the market. Although the bearish momentum has disappeared, the bulls are failing to establish any sustained momentum.
ADA/BTC – ADA Breaks Descending Price Channel.
Key Support Levels: 3200 SAT, 3130 SAT, 3000 SAT.
Key Resistance Levels: 3450 SAT, 3650 SAT, 3800 SAT.
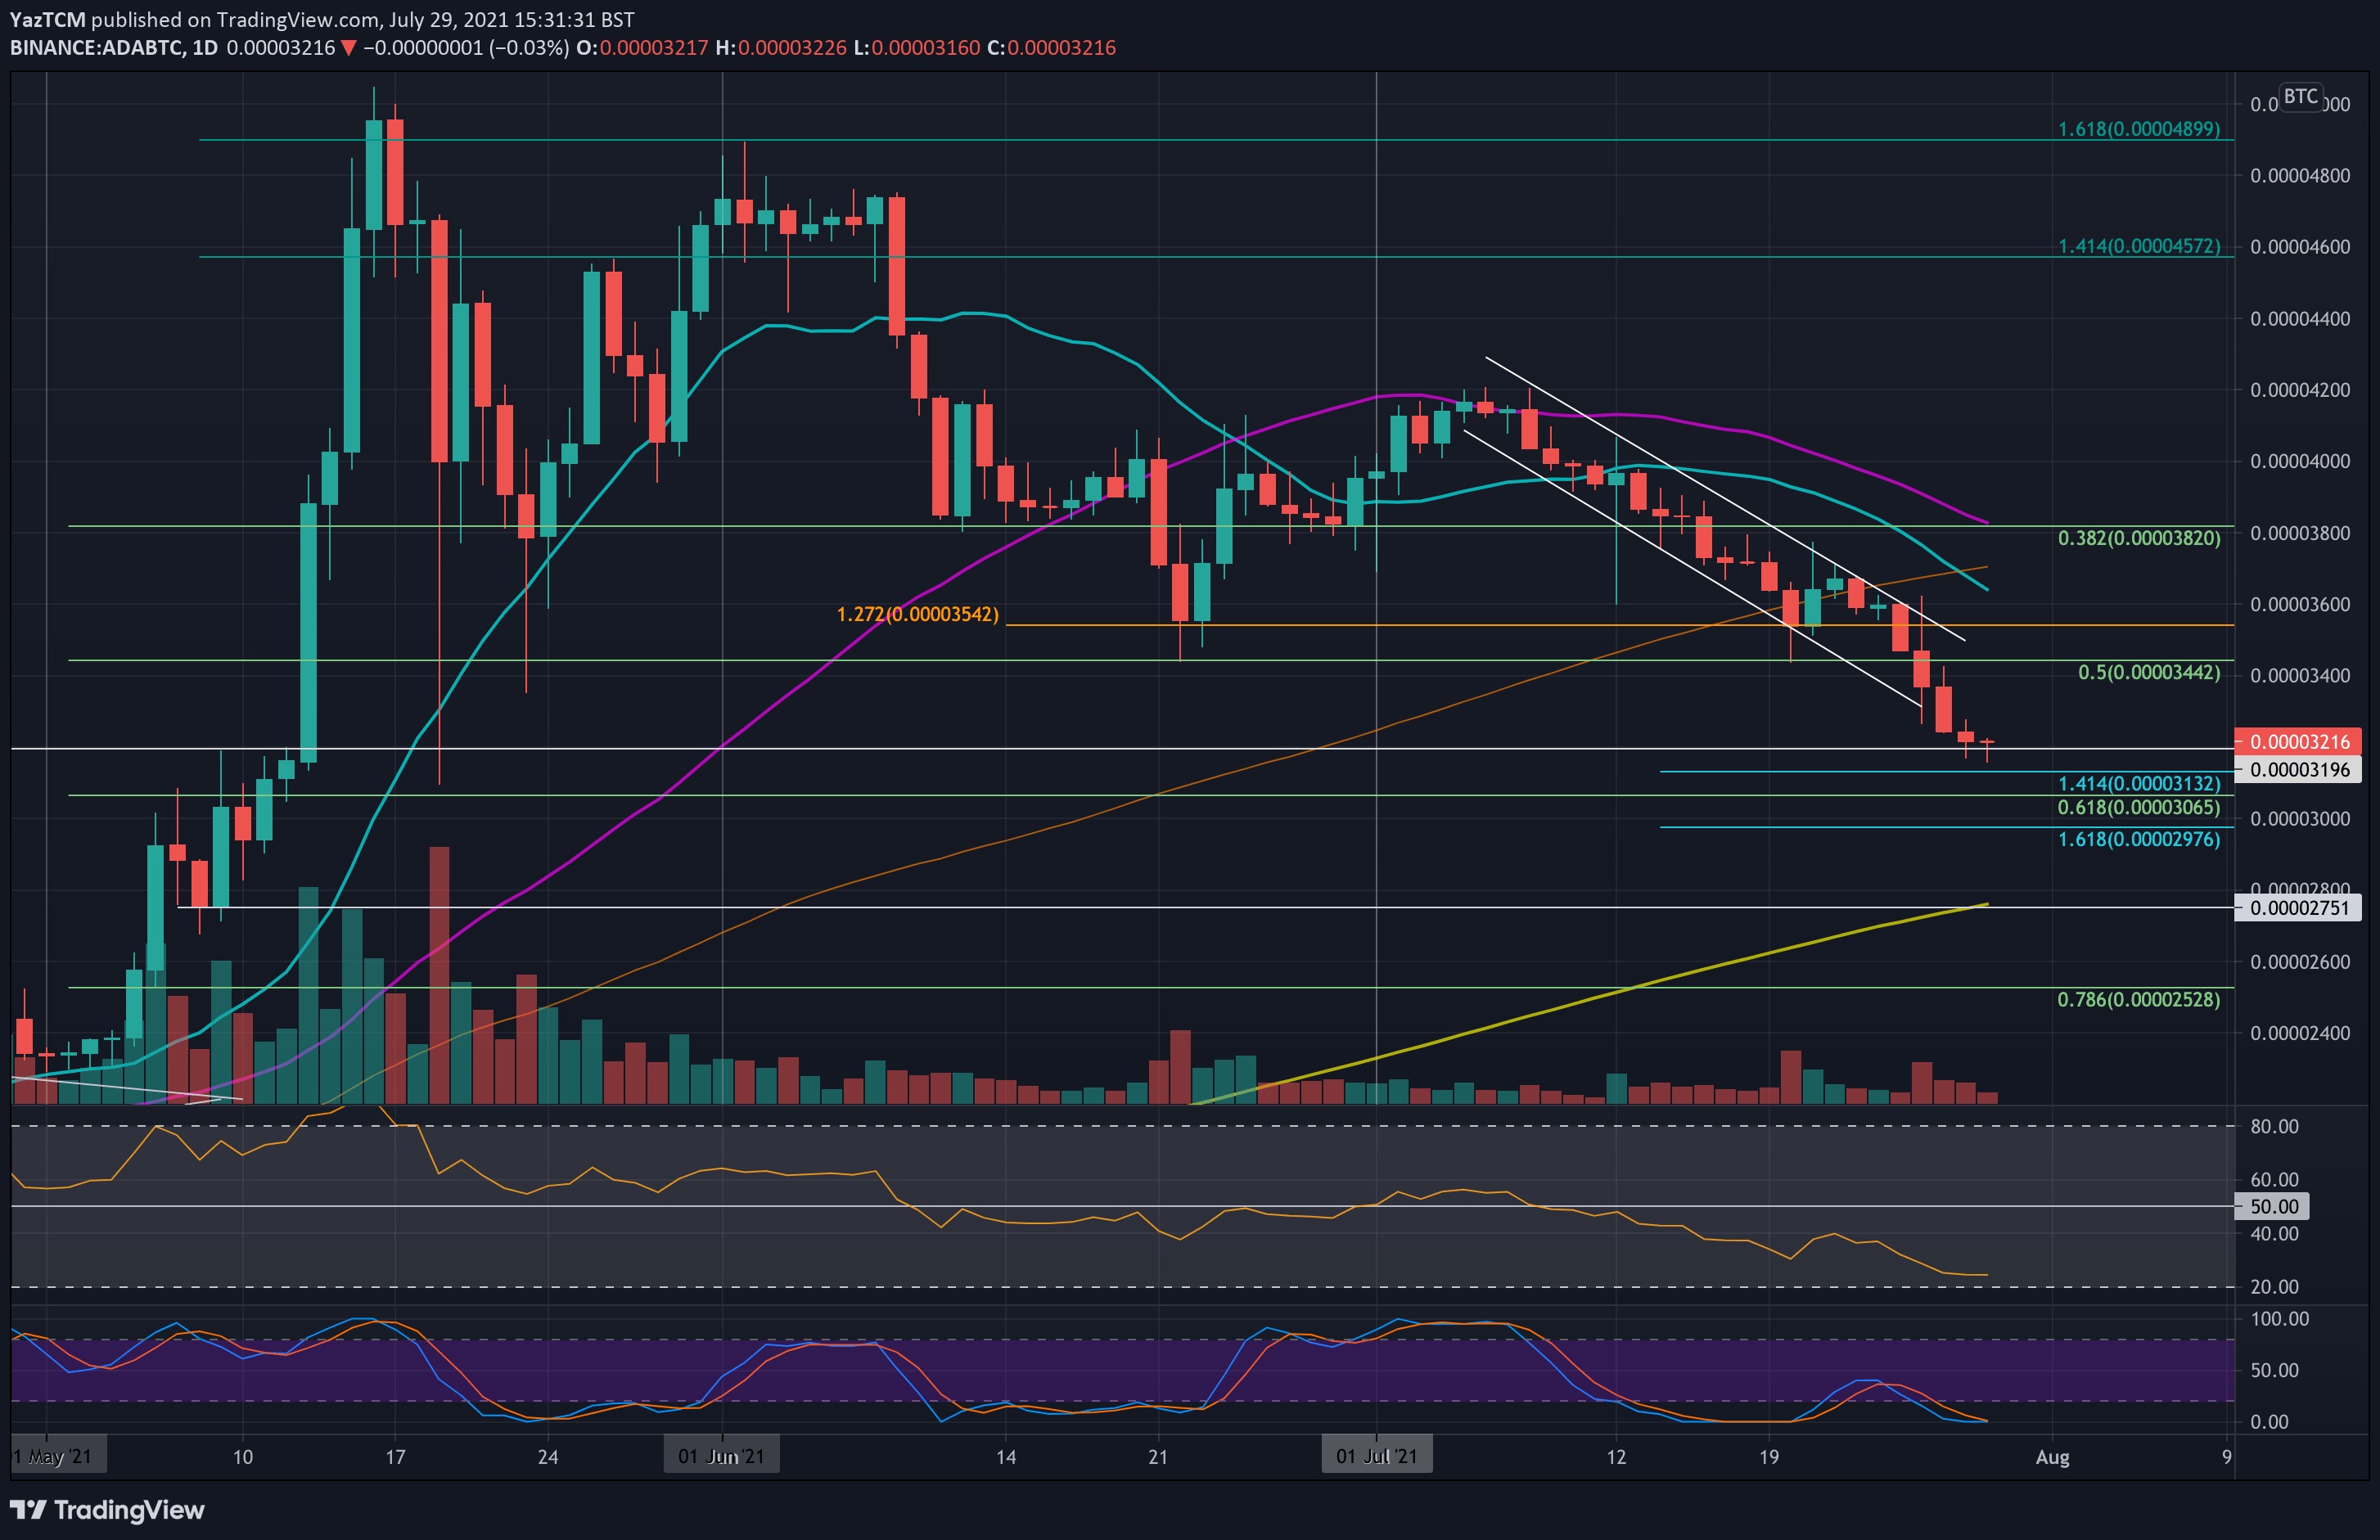
ADA is struggling against BTC as it battles to maintain 3200 SAT support. The cryptocurrency was trading inside a descending price channel but broke beneath the lower angle on Tuesday.
ADA is now trading at 2.5-month lows against BTC as the bearish momentum continues to dominate here. A break beneath 3200 SAT is likely to drive ADA back toward the 200-day MA at 2750 SAT.
ADA-BTC Short Term Price Prediction
Moving forward, the first support lies at 3200 SAT. This is followed by 3130 SAT (downside 1.414 Fib Extension) and 3000 SAT. Beneath 3000 SAT, strong support lies at 2750 SAT, provided by the 200-day MA.
On the other side, the first resistance lies at 3450 SAT. This is followed by 3650 SAT (20-day MA) and 3800 SAT (50-day MA).
The daily RSI is well beneath the midline as the bears hold complete control of the market momentum. However, the Stocahstic RSI is primed for a bullish crossover which could see some bullish pressure entering the market.
Binance Futures 50 USDT FREE Voucher: Use this link to register & get 10% off fees and 50 USDT when trading 500 USDT (limited offer).
PrimeXBT Special Offer: Use this link to register & enter POTATO50 code to get 50% free bonus on any deposit up to 1 BTC.
Disclaimer: Information found on CryptoPotato is those of writers quoted. It does not represent the opinions of CryptoPotato on whether to buy, sell, or hold any investments. You are advised to conduct your own research before making any investment decisions. Use provided information at your own risk. See Disclaimer for more information.
Cryptocurrency charts by TradingView.
, XRP and Cardano (ADA) Just Recorded Major Price Jumps – U.Today")


