


Cardano (ADA)
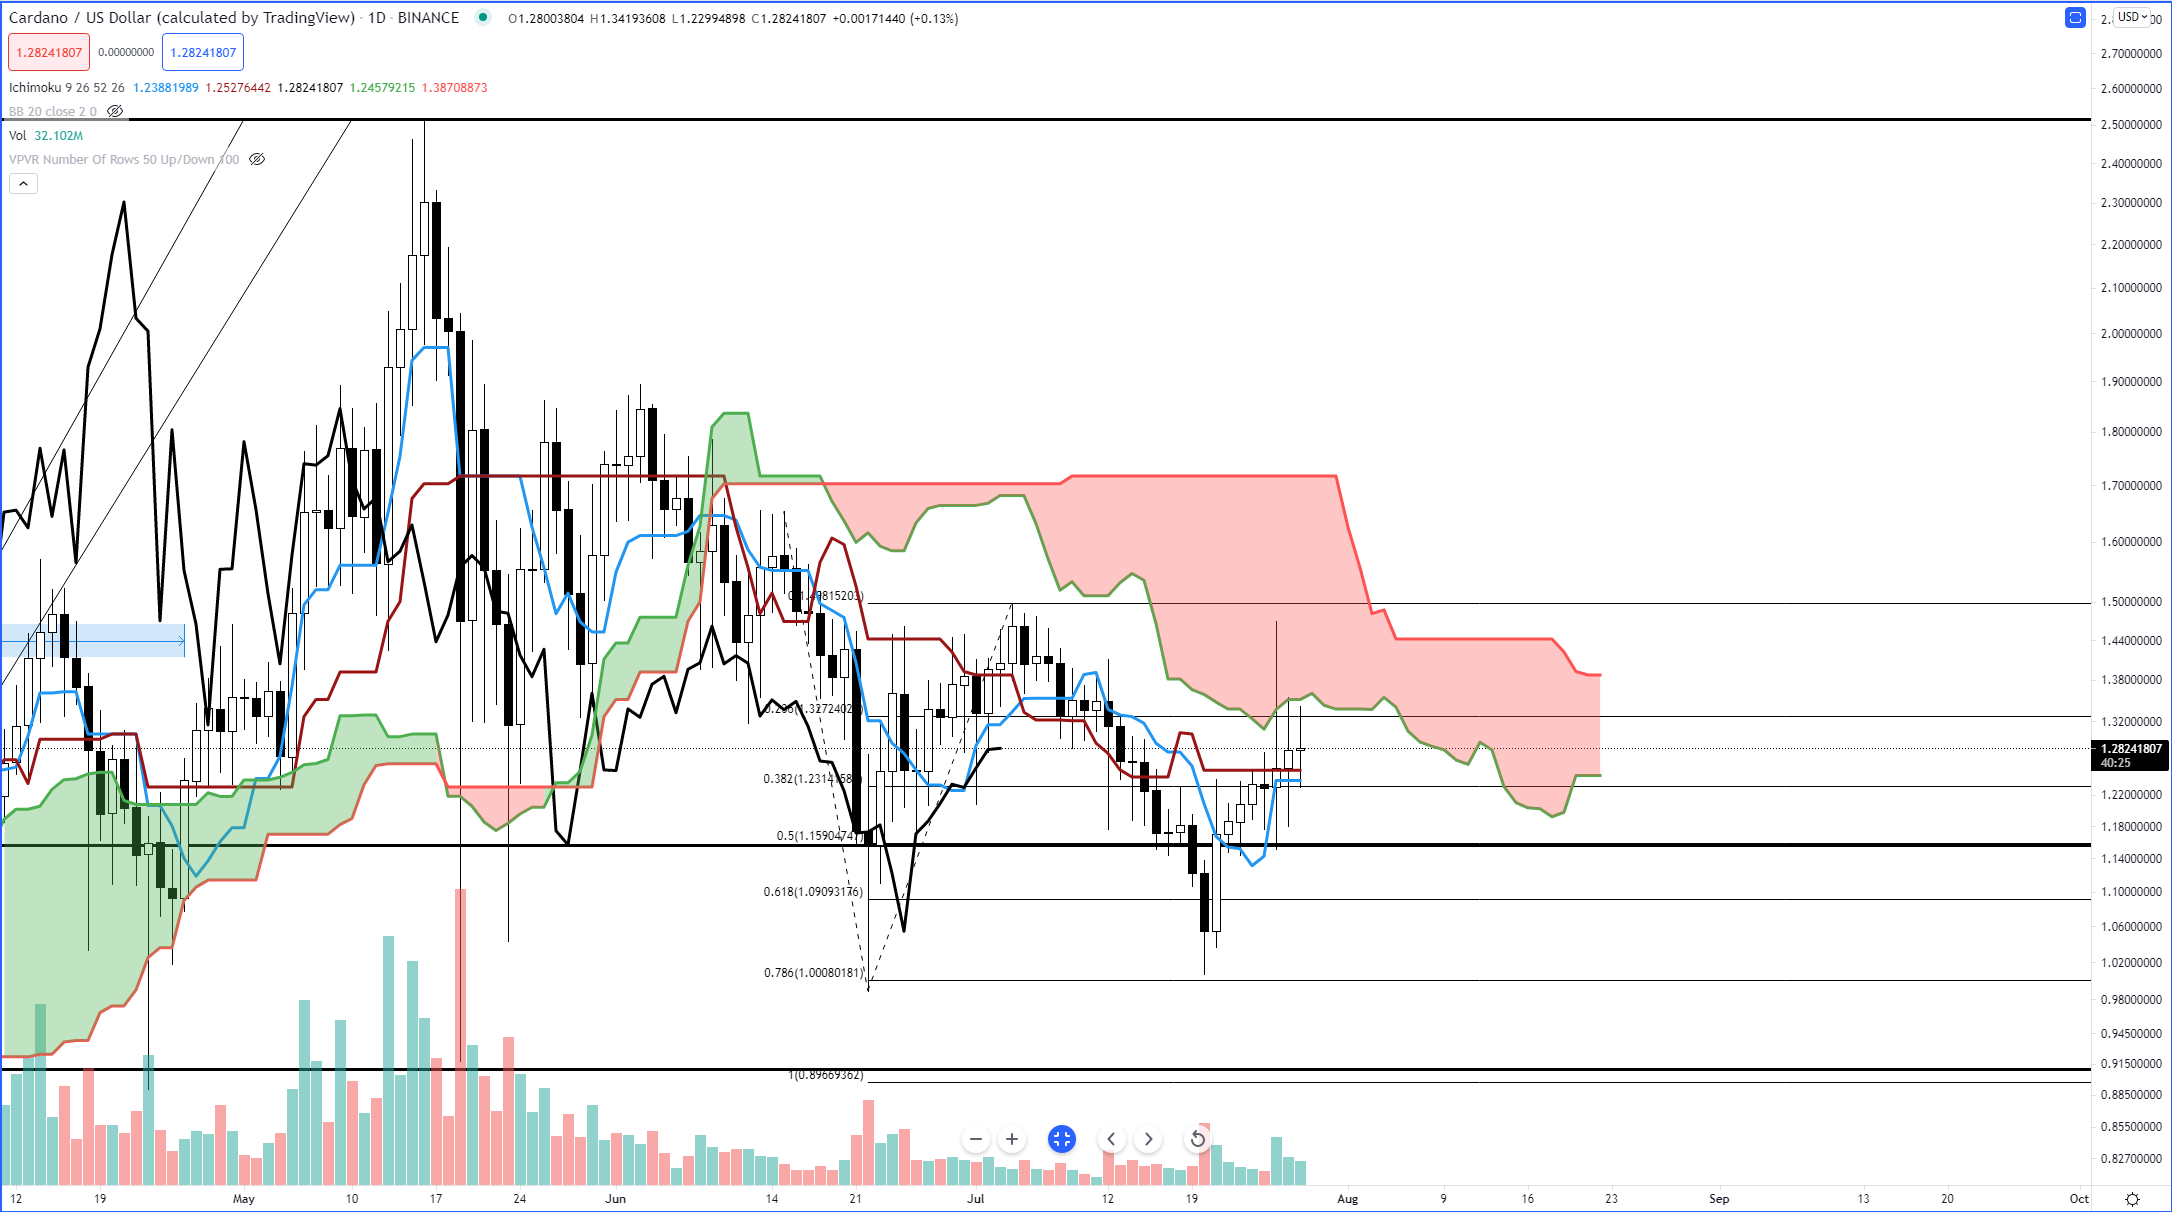
Above: Cardano (ADAUSD)
Cardano’s daily candlesticks are creeping closer and closer to the inside of the Cloud – a place I never want to be. The Kumo (or Cloud) is a place I affectionately refer to as: The Place Where Trading Accounts Go To Die. The Cloud is the epitome of whipsaws, indecision, confusion, volatility, sadness, depression, and punching of fists through monitors. In order for me to be on the bullish side of Cardano’s daily chart again, I need to see the Chikou Span on the daily chart move and close to at least $1.47. But if that were to happen today, that would put the current candlestick into the Cloud. Not until August 5th would the Chikou Span trading at $1.47 be a very positive sign because on August 5th, Cardano will be above the Cloud if its at $1.47. Upper resistance for Cardano over the remainder of the week is the $1.70 value area. On the short side of the market, watch for a clear a move and close below the daily Tenkan-Sen and Kijun-Sen, essentially a return to the $1.20 level. As long as the Chikou Span remains below the candlesticks and price is below the Cloud, bearish sentiment reigns.
Ethereum (ETH)
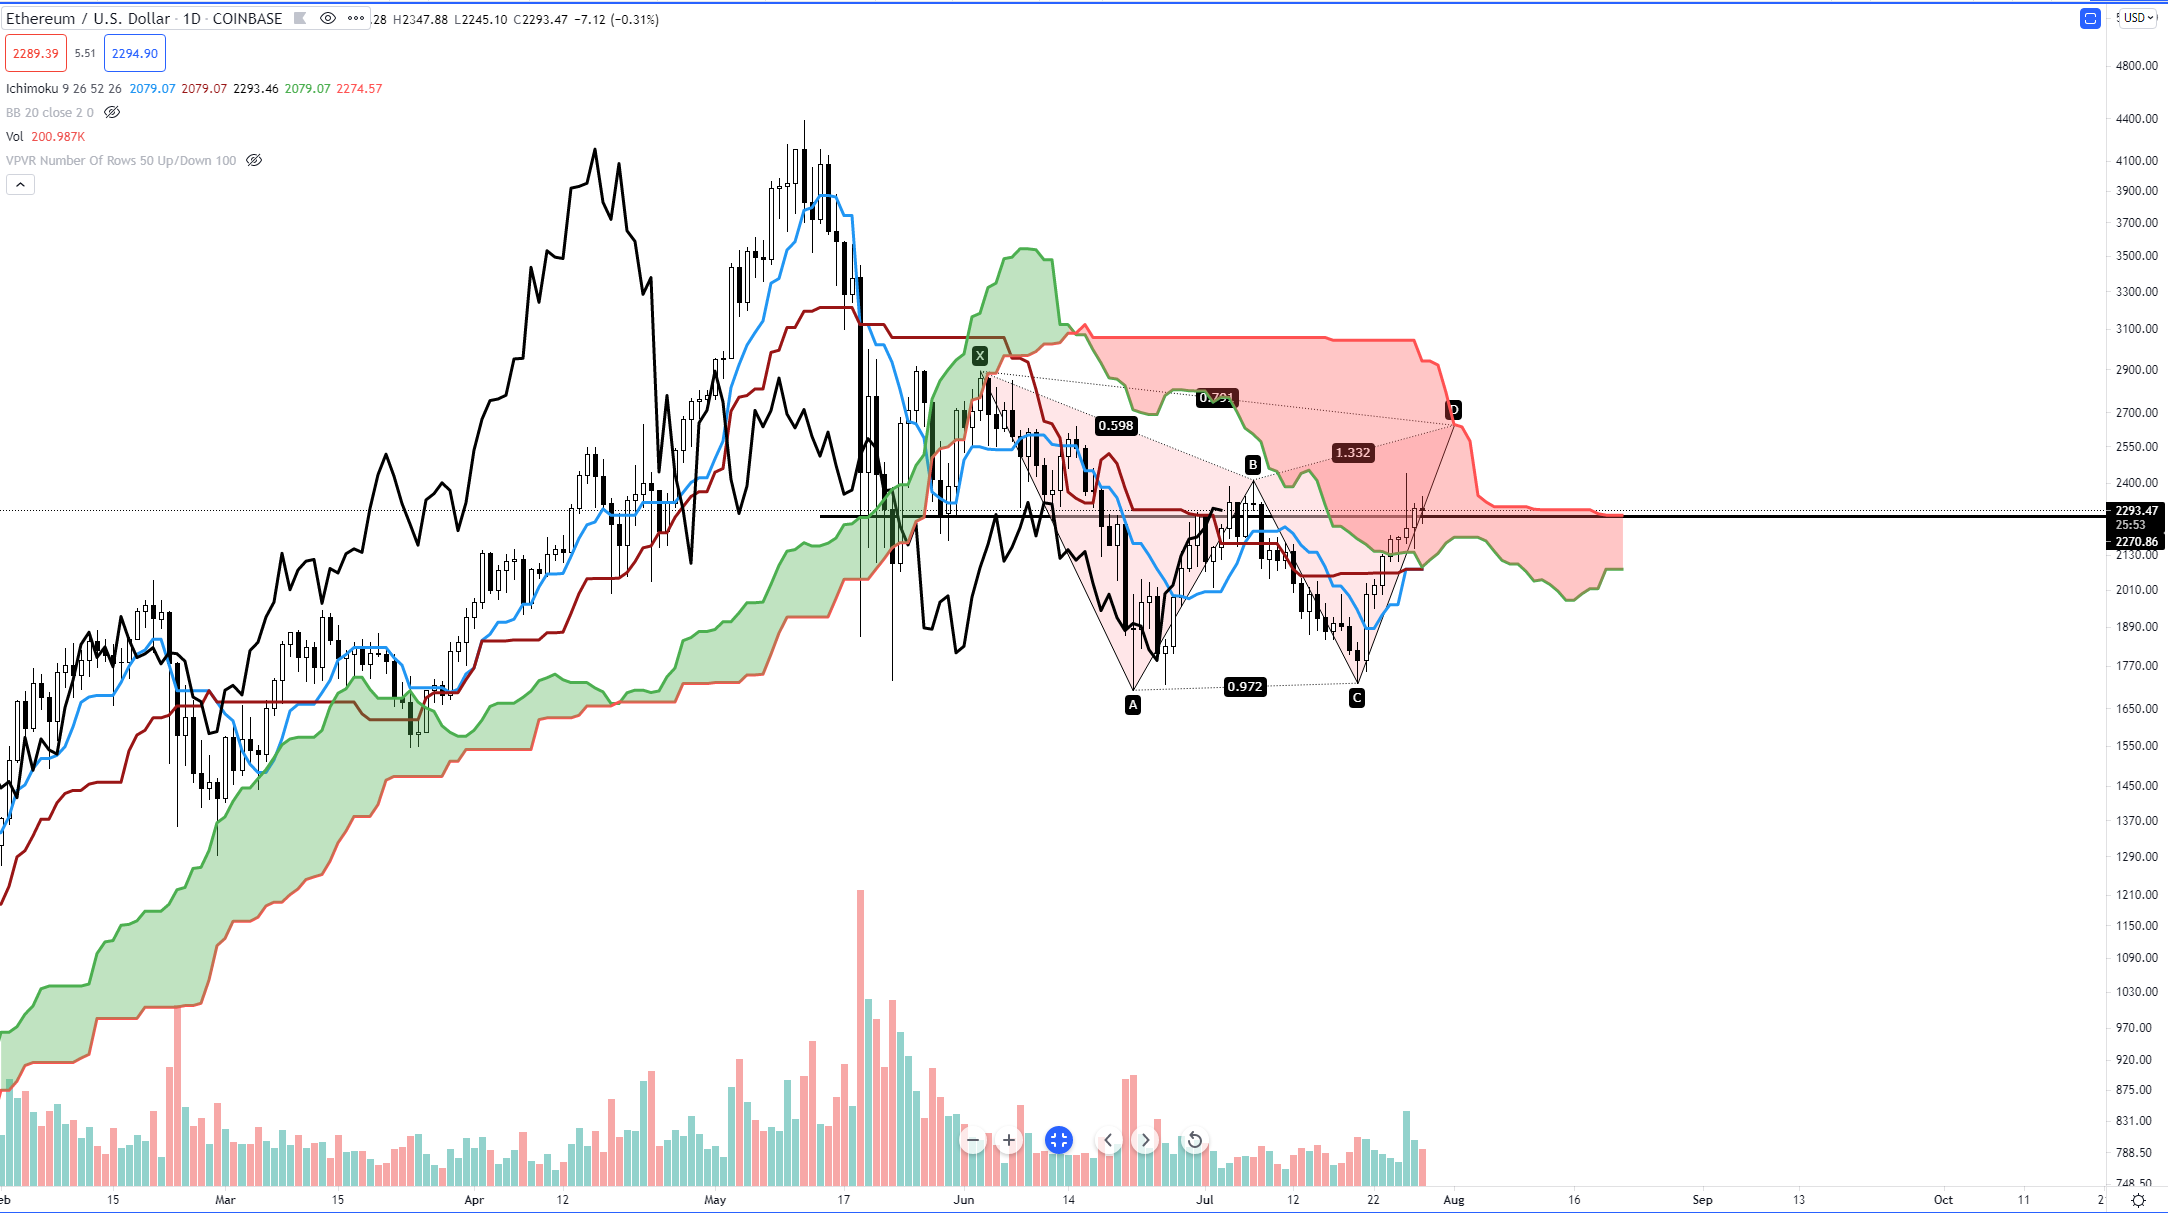
Above: Ethereum (ETHUSD)
Ethereum (ETH) is in the bad place – the Cloud. It does have some exceptionally strong support around the $2,100 level: Senkou Span A (bottom of the Cloud), the Tenkan-Sen and the Kijun-Sen. Those three levels should provide at least some support of Ethereum does drop. On the resistance side of things, the top of the Cloud – Senkou Span B – is all that remains. Senkou Span B is the most difficult level for price to cross and close above. Senkou Span B is the strongest area of support/resistance within the Ichimoku system. Consequently, if Ethereum were to test Senkou Span B as resistance, it would likely complete a bearish Gartley pattern. In other words, expect some selling pressure if Ethereum moves into the $2,600 – $2,800 value areas. For me to convert to the bullish side of the trade, I’d need to see the Lagging Span close above $2,350 level and have the current close above the Cloud. For both of those conditions to be true, the earliest that this could occur I on August 4th. Any breakout above the Cloud will likely generate substantial buying volume and could easily propel Ethereum to the $5,000 value area before experiencing any major selling. On the short side of the trade, the same value areas I’ve written and discussed remain: the $1,200 – $1,400 levels remain the next support zones to test for Ethereum.

Advertisement
Save money on your currency transfers with TorFX, voted International Money Transfer Provider of the Year 2016 – 2020. Their goal is to connect clients with ultra competitive exchange rates and a uniquely dedicated service whether they choose to trade online or over the telephone.
Find out more here.


