


Bitcoin price started a fresh increase above the $38,500 resistance zone against the US Dollar. BTC even broke $40,000 and it is now correcting gains.
- Bitcoin gained traction above the $38,500 and $39,500 resistance levels.
- The price is now trading above $40,000 and the 100 hourly simple moving average.
- There was a break above a key bearish trend line with resistance near $39,000 on the hourly chart of the BTC/USD pair (data feed from Kraken).
- The pair is correcting gains, but the bulls are likely to remain active near $39,000.
Bitcoin Price Turns Green
Bitcoin price formed a base above the $37,600 level and started a fresh increase. BTC broke the key $38,500 resistance level to move into a positive zone.
The price even broke the $39,000 resistance level and settled well above the 100 hourly simple moving average. Finally, there was a break above the $40,000 resistance zone. There was also a break above a key bearish trend line with resistance near $39,000 on the hourly chart of the BTC/USD pair.
The price traded as high as $41,395 before there was a downside correction. Bitcoin traded below the $40,500 support level. There was a break below the 23.6% Fib retracement level of the recent increase from the $37,678 swing low to $41,395 high.
It is now consolidating near the $40,000 support zone. On the upside, an initial resistance is near the $40,500 level. The first key resistance is near the $40,750 level and a connecting bearish trend line.
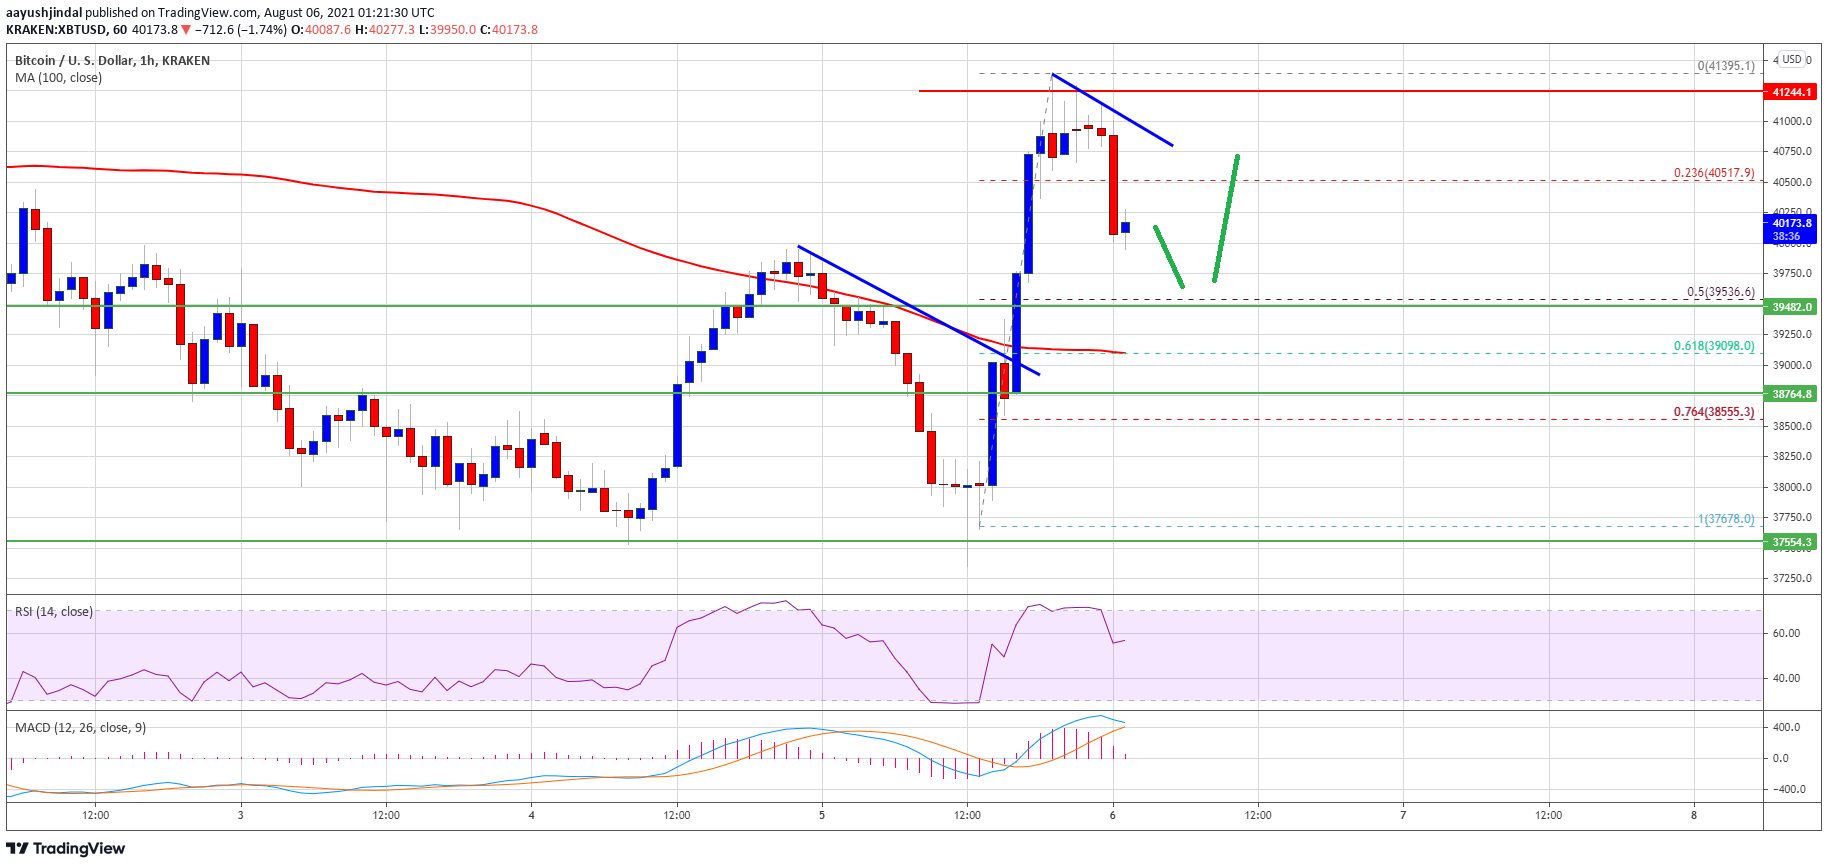
Source: BTCUSD on TradingView.com
Therefore, a close above the $40,750 resistance zone and the trend line might trigger a steady increase. The next major resistance is near the $41,500 level. Any more gains could set the pace for a move towards the $42,500 resistance zone in the near term.
Fresh Decline in BTC?
If bitcoin fails to climb above the $40,750 and $41,500 resistance levels, it could start a fresh downside correction. An initial support on the downside is near the $49,000 level.
The first major support is now near the $39,500 zone. It is near the 50% Fib retracement level of the recent increase from the $37,678 swing low to $41,395 high. A clear downside break below the $39,500 support might lead the price towards the $38,500 support.
Technical indicators:
Hourly MACD – The MACD is slowly losing pace in the bullish zone.
Hourly RSI (Relative Strength Index) – The RSI for BTC/USD is now well above the 50 level.
Major Support Levels – $39,500, followed by $38,500.
Major Resistance Levels – $40,500, $40,750 and $41,500.


