


Bitcoin (BTC)
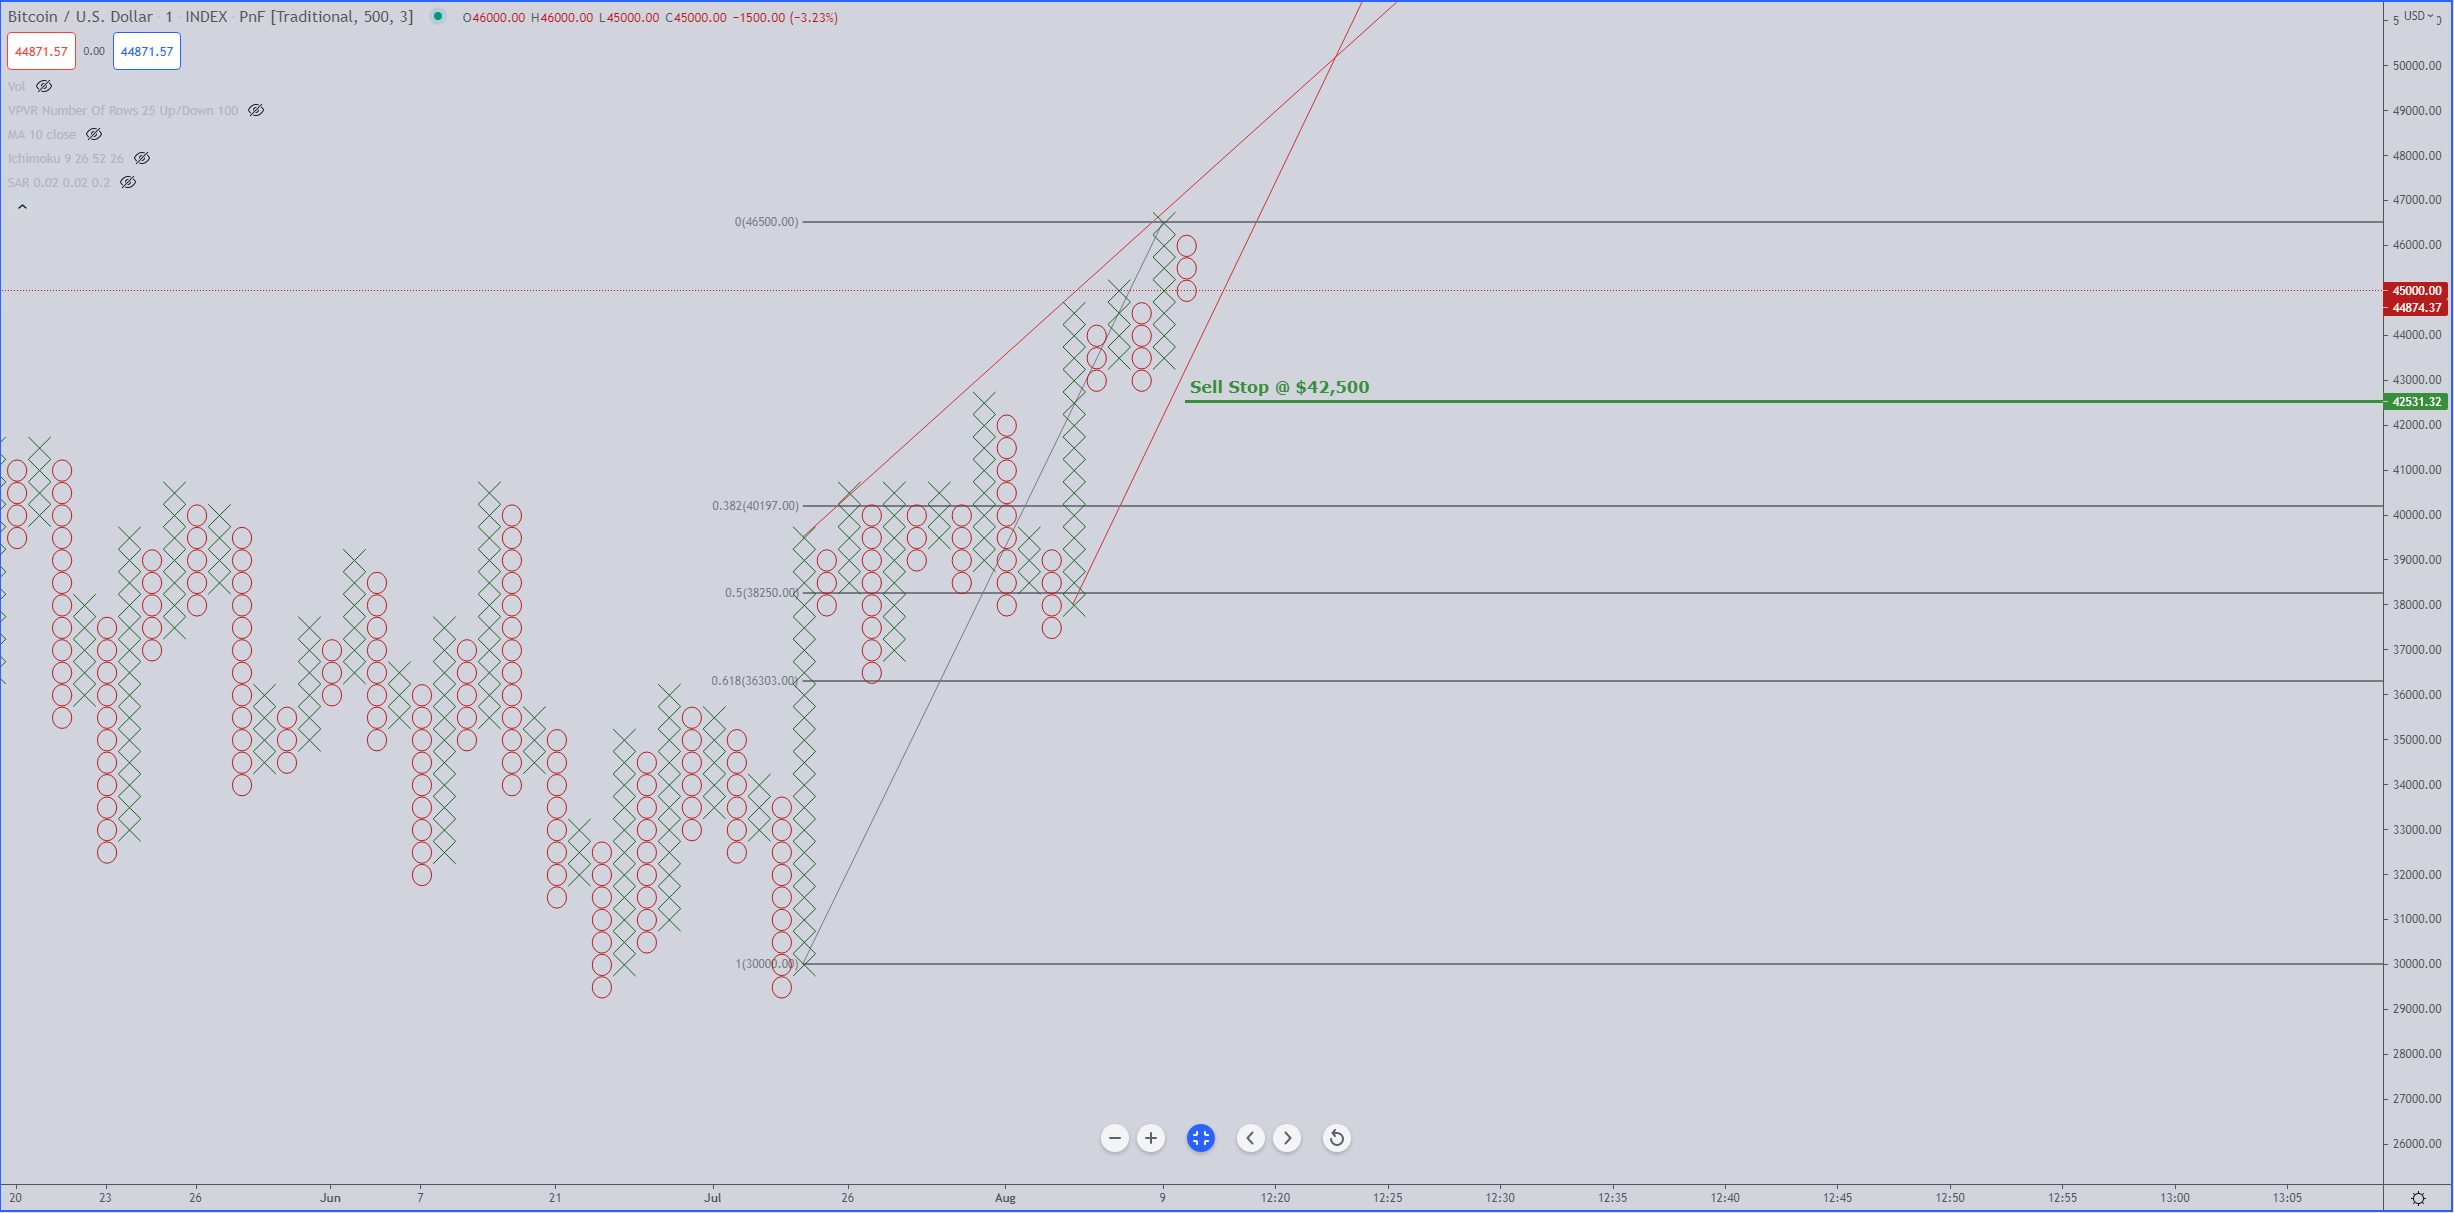
Above: Bitcoin (BTCUSD)
The image above is Bitcoin’s $500/3-box reversal Point and Figure chart. There is a clear rising wedge pattern on this chart – wedge patterns are some of the single most powerful triangle and most powerful reversal pattern in technical analysis. A short idea I have for Bitcoin is a sell stop @ $42,500 with a profit target near $38,000. The sell stop at $42,500 is the confirmation break of a triple bottom at $43,000 and the break of the bottom trendline in the rising wedge. $38,250 is the 50% Fibonacci Retracement of the most recent swing high at $46,500 and the confirmation swing low at $31,000. $38,000 is also the daily Kijun-Sen on Bitcoin’s Ichimoku chart.
Cardano (ADA)
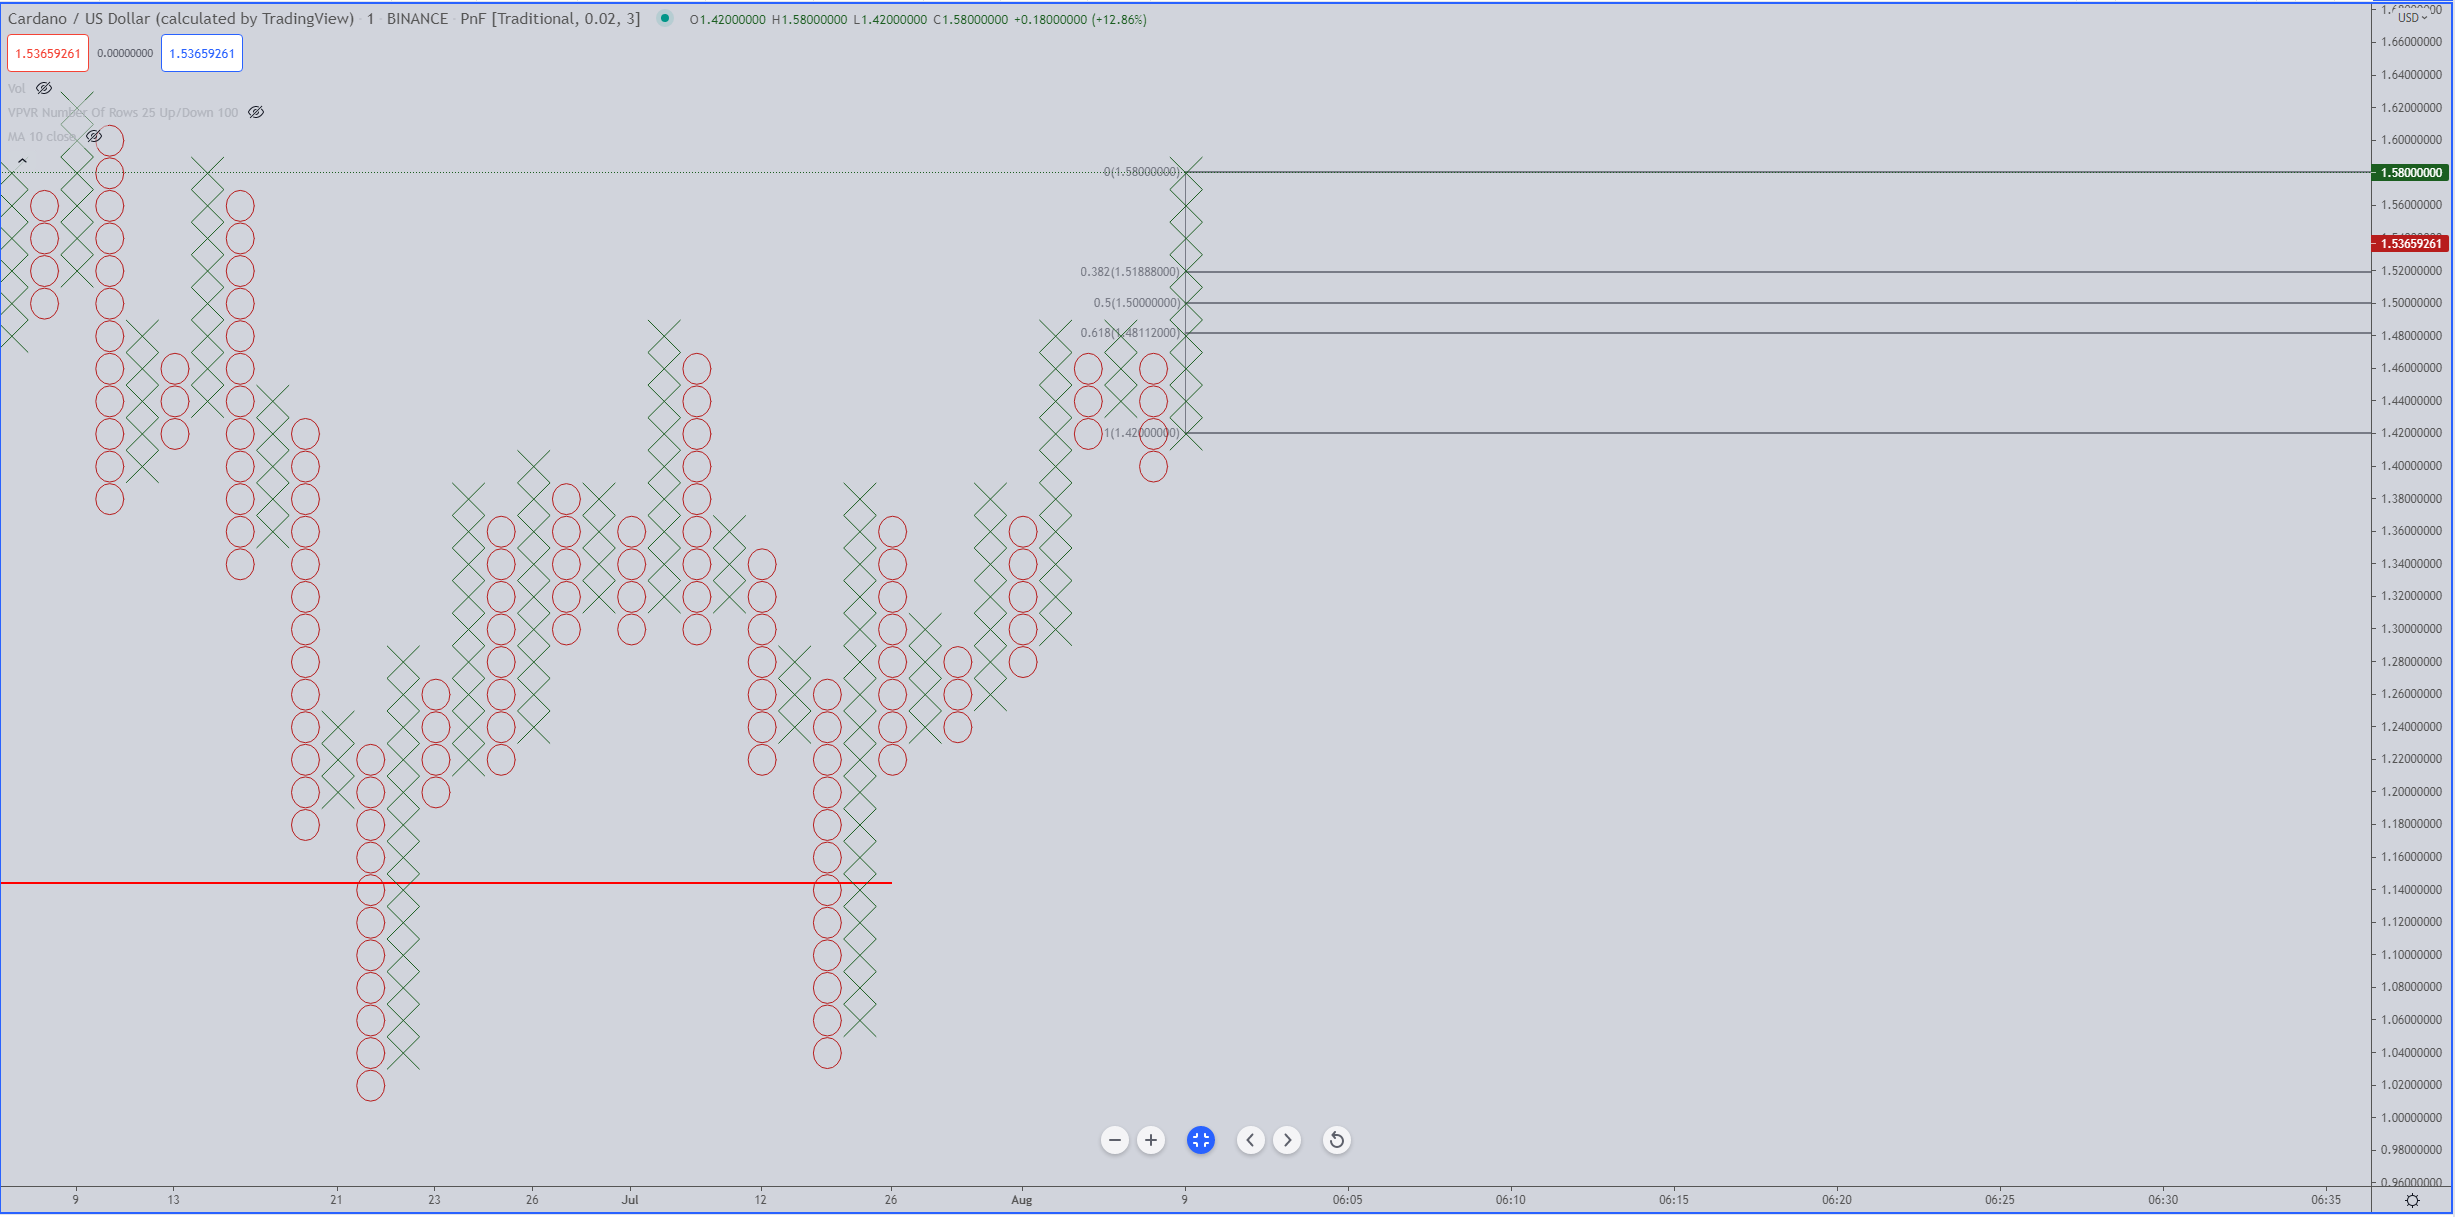
Above: Cardano (ADAUSD)
Cardano has had an amazing run during the Tuesday trading session, moving up as much as +11.3% during the intraday period. The chart above is Cardano’s $0.02/3-box reversal chart. The current pattern is known as Pole Pattern – which means the entry on a short setup would be at the 50% retracement of the X-column. However, that entry would place a short just above the triple top – not a place I would like to enter. An entry at $1.48 is the 61.8% Fibonacci Retracement and could be a more likely entry, but I would wait for either a triple bottom or a split triple bottom before entering short. The entry for that short upon confirmation of a triple bottom or split triple bottom would be at $1.38 with a profit target near $1.25.
Ripple (XRP)

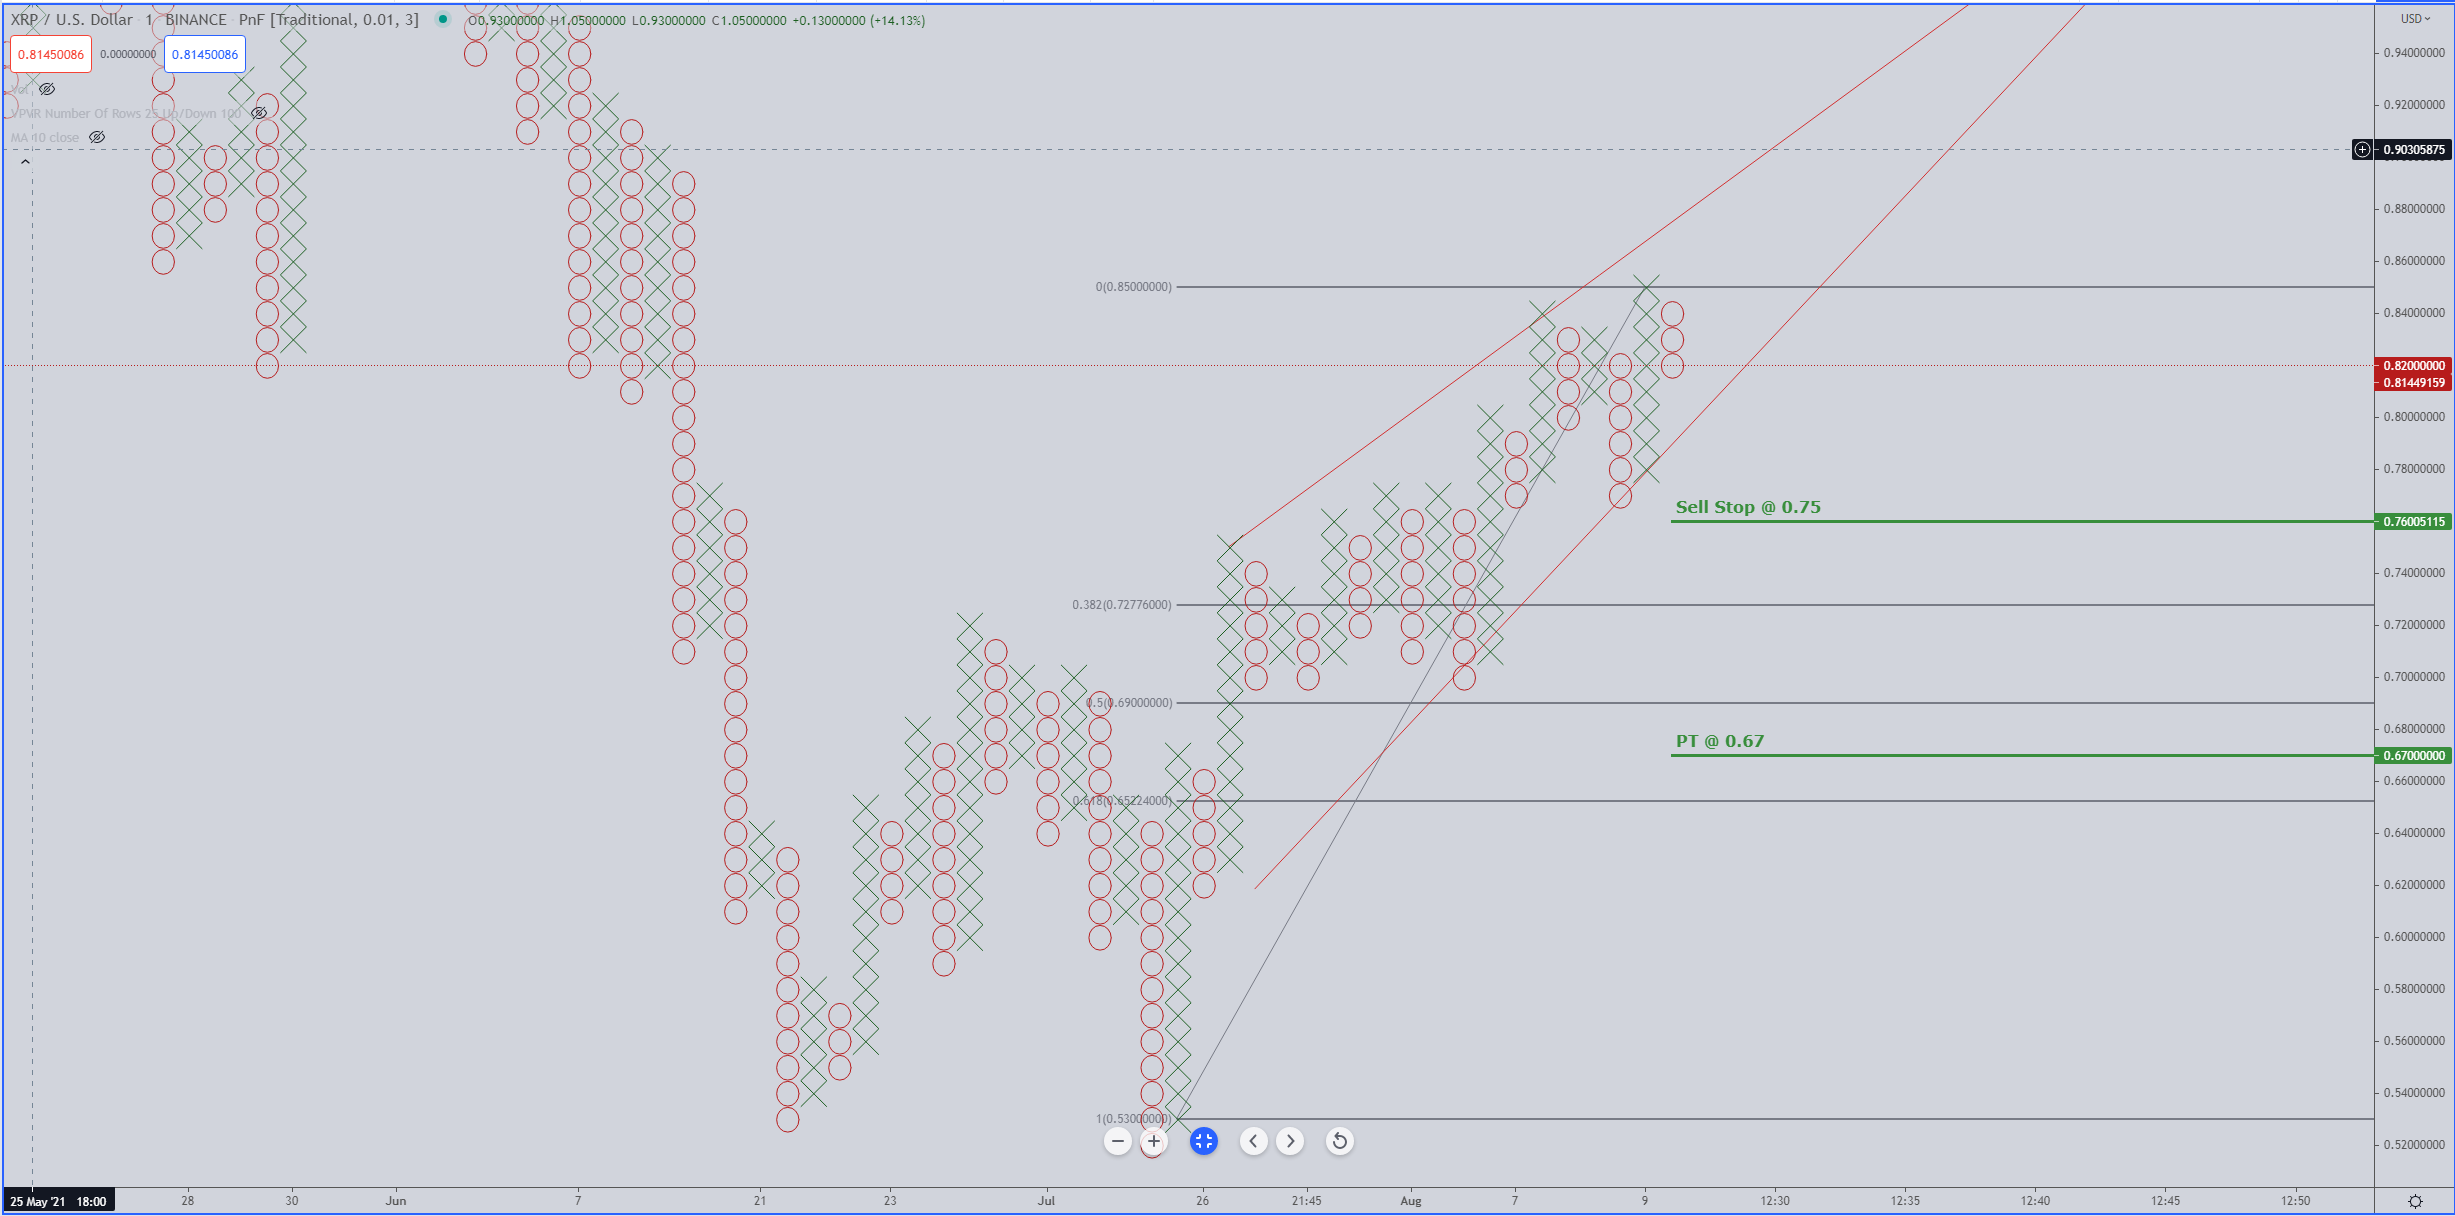
Above: Ripple (XRPUSD)
Ripple, like Bitcoin, has a massive bearish rising wedge pattern on its chart. The $0.01/3-box reversal chart for Ripple shows a very, very nice short entry opportunity. You’ll notice that the prior double top resulted in a bullish buy signal at $0.84 and then moved one more X higher to $0.85. Because there was only two X’s above the double top, that creates a possible setup for a Bull Trap pattern on the Point and Figure chart. The sell stop idea at $0.75 fulfills two bearish entry conditions. First is the break of a double bottom. Second is the break below the rising wedge trendline. The profit target area for Ripple would be at $0.67. That target is based on the utilization of the vertical profit target method used in Point and Figure analysis. $0.67 also falls between the 50% and 61.8% Fibonacci retracements.
Advertisement
Save money on your currency transfers with TorFX, voted International Money Transfer Provider of the Year 2016 – 2020. Their goal is to connect clients with ultra competitive exchange rates and a uniquely dedicated service whether they choose to trade online or over the telephone.
Find out more here.


