


Bitcoin price is facing a strong resistance near $46,700 against the US Dollar. BTC is likely to nosedive if it continues to struggle above the $46,500 resistance.
- Bitcoin is still struggling to clear the $46,500 and $46,700 resistance levels.
- The price is now above the $45,000 zone and the 100 hourly simple moving average.
- There was a break below a major bullish trend line with support near $46,000 on the hourly chart of the BTC/USD pair (data feed from Kraken).
- The pair must stay above the $45,000 support to avoid a major decline in the near term.
Bitcoin Price Faces Hurdles
Bitcoin price is still facing a strong barrier near the $46,500 and $46,700 resistance levels. BTC is currently consolidating well below the $46,700 resistance zone.
Recently, there was a minor downside correction from the $46,699 high. The price traded below the $46,000 support level. There was a break below the 50% Fib retracement level of the upward move from the $44,714 swing low to $46,699 high.
Besides, there was a break below a major bullish trend line with support near $46,000 on the hourly chart of the BTC/USD pair. The pair is now above the $45,000 zone and the 100 hourly simple moving average. An immediate support on the downside is near the $45,450 level.
The 61.8% Fib retracement level of the upward move from the $44,714 swing low to $46,699 high is also sitting near the $45,450 level. On the upside, an initial resistance is near the $46,200 level.
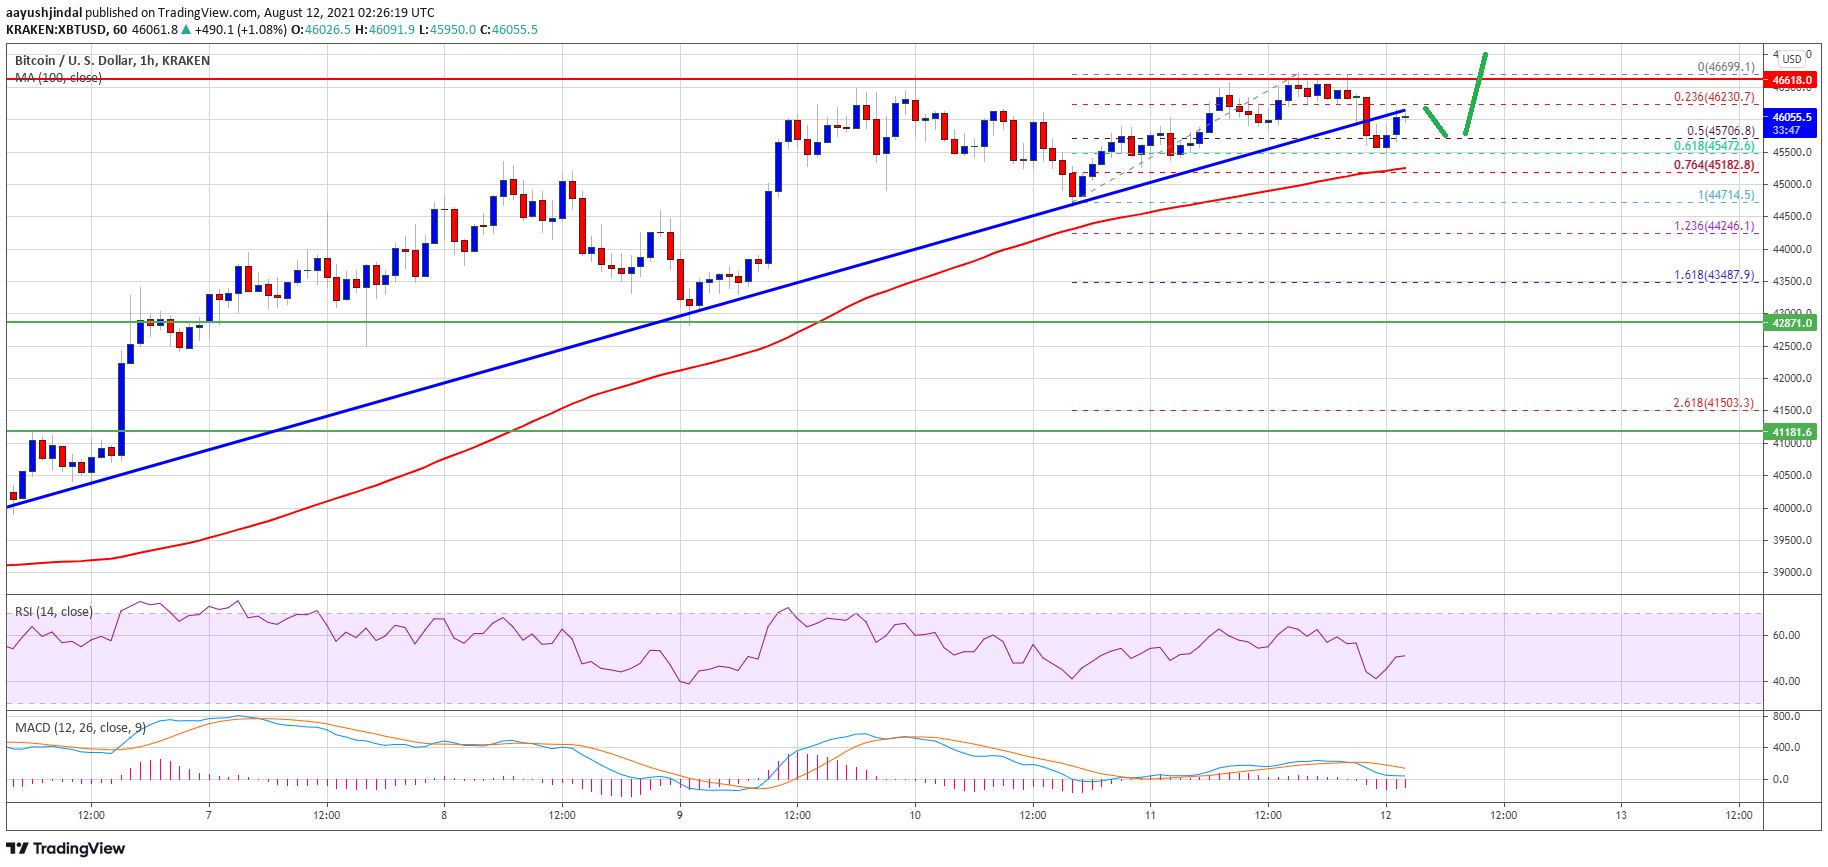
Source: BTCUSD on TradingView.com
The first key resistance is near the $46,500 level. The main resistance is now forming near the $46,700 level. A clear break above the $46,700 is must to start another increase. In the stated case, the price might easily rise towards the $47,500 level. The next major resistance is near the $48,000 level.
Sharp Decline in BTC?
If bitcoin fails to climb above the $46,200 and $46,500 resistance levels, it could continue to move down. An initial support on the downside is near the $45,450 level.
The first major support is now near the $45,200 zone and the 100 hourly SMA. The main support could be $45,000. Therefore, a clear downside break below the $45,000 support zone could trigger a sharp decline. The next major support could be $43,200.
Technical indicators:
Hourly MACD – The MACD is slowly losing pace in the bullish zone.
Hourly RSI (Relative Strength Index) – The RSI for BTC/USD is now near the 50 level.
Major Support Levels – $45,200, followed by $45,000.
Major Resistance Levels – $46,200, $46,500 and $46,700.


 Reattempts Breakout, Bulls Eye Strong Rally Move")


