


Bitcoin price failed to continue higher above $46,700 against the US Dollar. BTC is correcting gains and it might revisit the $42,850 support zone.
- Bitcoin failed to clear the $46,500 and $46,700 resistance levels.
- The price is now trading below $45,000 and the 100 hourly simple moving average.
- There was a break below a key bullish trend line with support near $45,900 on the hourly chart of the BTC/USD pair (data feed from Kraken).
- The pair is likely to extend its decline towards the $43,000 and $42,850 support levels.
Bitcoin Price Starts Downside Correction
Bitcoin price failed to continue higher above the $46,500 and $46,700 resistance levels. As a result, BTC reacted to the downside below the $46,000 support zone.
There was a break below a key bullish trend line with support near $45,900 on the hourly chart of the BTC/USD pair. The pair broke the $45,000 support level and it settled below the 100 hourly simple moving average. It even traded below the $44,000 level.
A low was formed near $43,785 and the price is now correcting losses. It recovered above the $44,000 and $44,500 levels. There was a break above the 23.6% Fib retracement level of the recent decline from the $46,758 swing high to $43,785 low.
On the upside, an initial resistance is near the $45,000 level. The first key resistance is near the $45,250 level and the 100 hourly simple moving average. It is near the 50% Fib retracement level of the recent decline from the $46,758 swing high to $43,785 low.
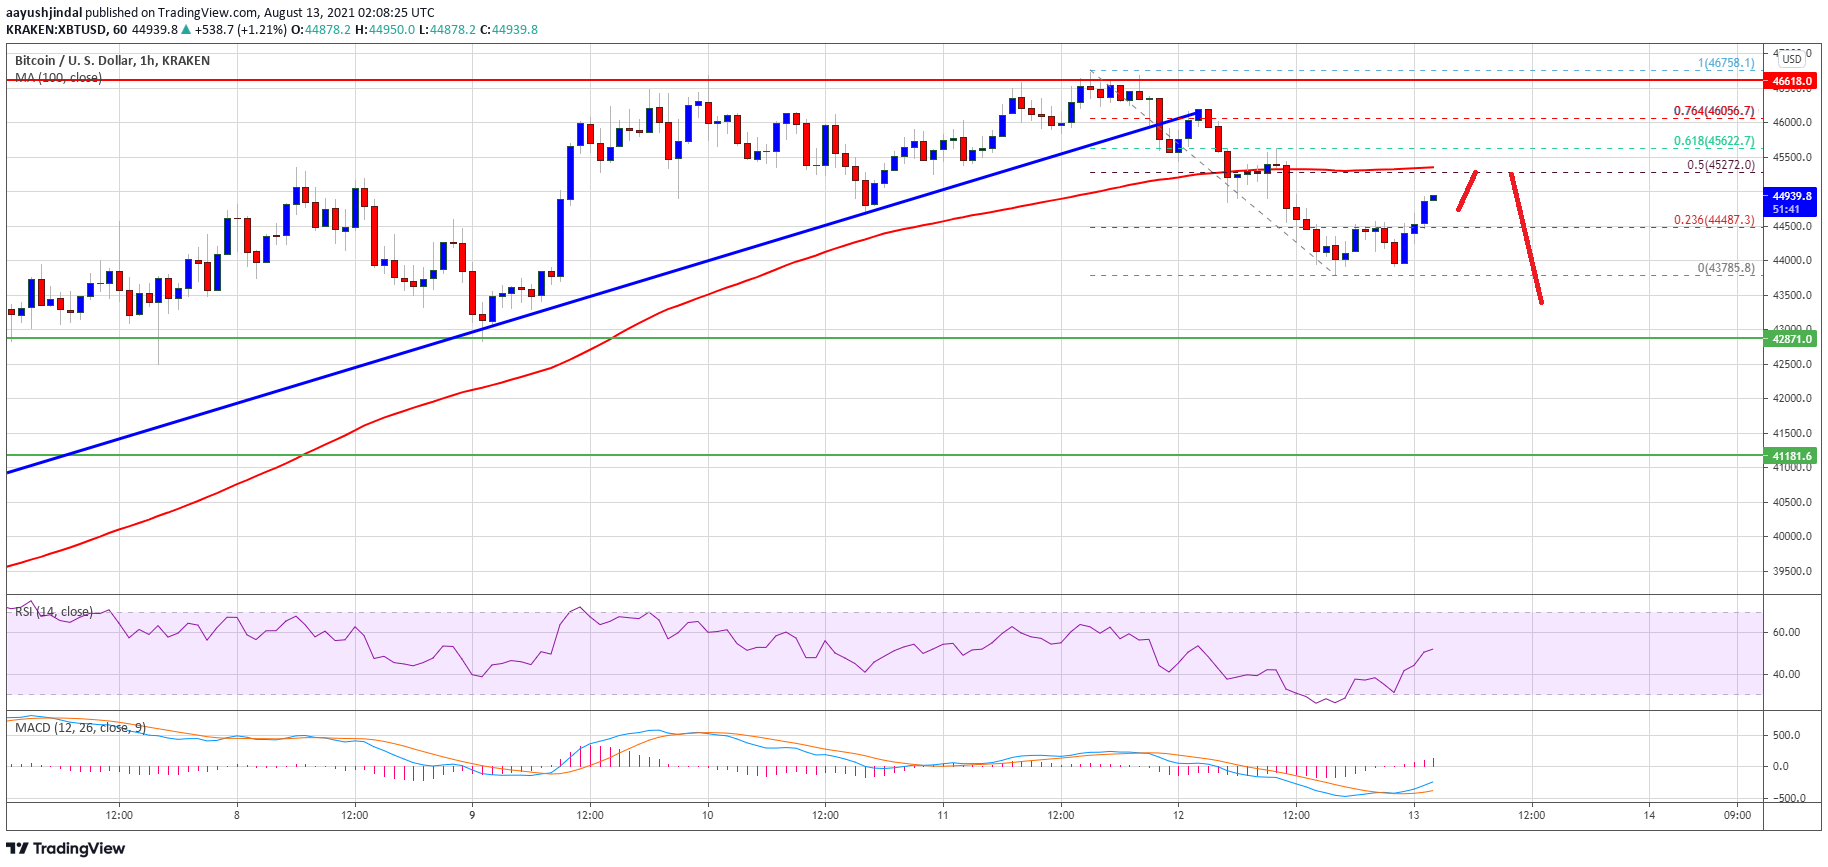
Source: BTCUSD on TradingView.com
The next main resistance is now forming near the $45,500 level. A clear break above the $45,250 and $45,500 resistance levels could start a decent increase.
More Losses in BTC?
If bitcoin fails to climb above the $45,250 and $45,500 resistance levels, it could continue to move down. An initial support on the downside is near the $44,500 level.
The first major support is now near the $44,000 zone. If the price fails to stay above the $44,000 support level, it could move down towards the $43,000 support level. The next major support is near $42,850, where the bulls are likely to take a stand.
Technical indicators:
Hourly MACD – The MACD is slowly gaining pace in the bullish zone.
Hourly RSI (Relative Strength Index) – The RSI for BTC/USD is now above the 50 level.
Major Support Levels – $44,500, followed by $44,000.
Major Resistance Levels – $45,000, $45,250 and $45,500.


