


Dogecoin, Cardano, Bitcoin, Ethereum Talking Points:
- Alt coins of Dogecoin and Cardano (ADA/USD) put in strong breakouts over the weekend.
- Bitcoin and Ethereum put in more restraint in their moves but both present near-term breakout potential, as well.
- The analysis contained in article relies on price action and chart formations. To learn more about price action or chart patterns, check out our DailyFX Education section.
It was another eventful weekend in cryptocurrencies but this week, it was the alt coins that were getting attention. Both Cardano and Dogecoin broke out to fresh near-term highs while Ethereum and Bitcoin consolidated recent gains.
In Cardano, the recent announcement of September 12th as the date for the Alonzo hard fork has continued to keep bulls on the bid and prices put in a strong move towards the all-time-high over the weekend. Resistance ended up showing at the 2.2500 psychological level. The corresponding pullback has thus far been light, with buyers holding the coin above the 2.0000 area on the chart.
The backdrop here appears to remain very bullish, with breakout potential beyond that 2.2500 level, with eyes on a test of that all-time-high around the 2.4500 figure.
To learn more about how psychological levels impact technical analysis, check out DailyFX Education
Cardano (ADA/USD) Daily Price Chart
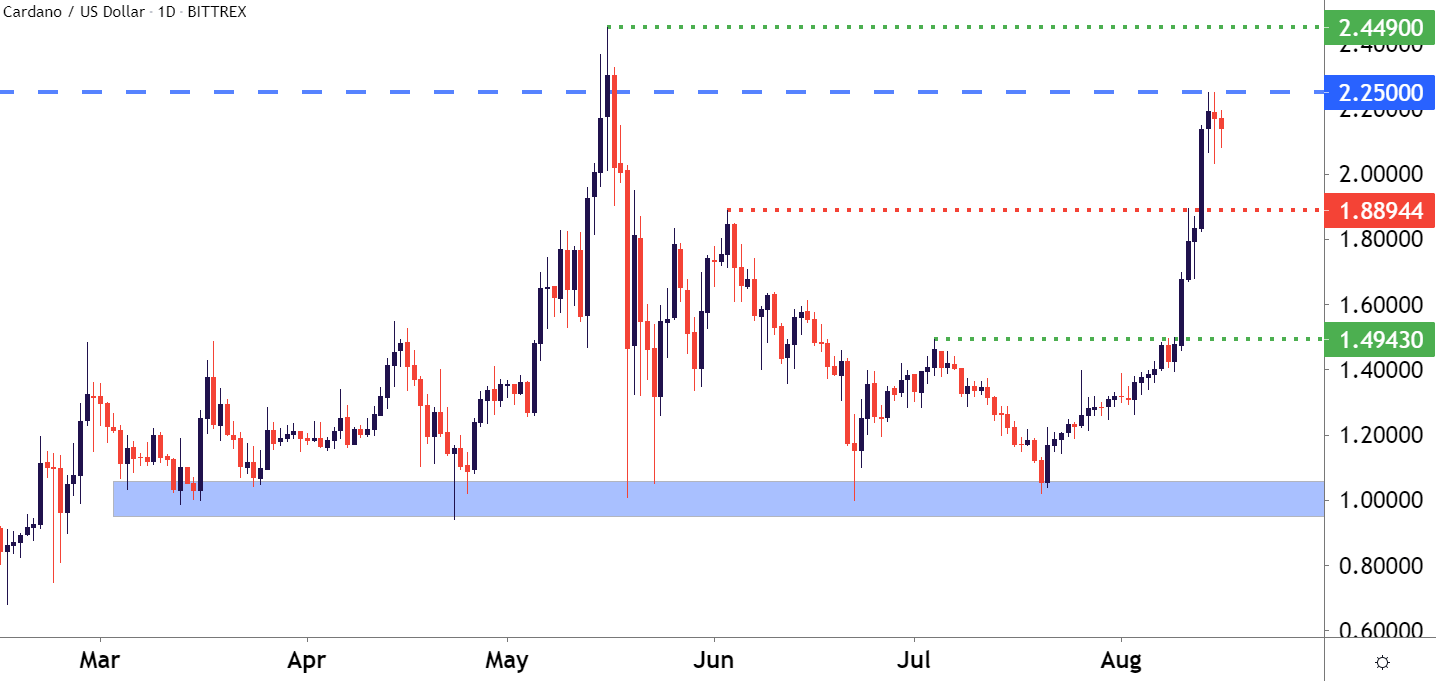
Chart prepared by James Stanley; Cardano on Tradingview
Dogecoin Fresh Two Month Highs
In perhaps an unexpected twist, Dogecoin is back in the news as both Mark Cuban and Elon Musk agreed over Twitter that Dogecoin was the strongest cryptocurrency as an actual medium of exchange. Both have talked about Doge in the past with Musk going so far as to say he was going to take the cryptocurrency to the moon while Mark Cuban had accepted the currency as payment for Dallas Mavericks games.
The common refrain against Doge as a store of value is the 5.2 Billion new coins minted each year. But, as Cuban had framed it on Twitter, that’s something that he perceives as a strength for the cryptocurrency’s usage as a medium of exchange.
Nonetheless, Dogecoin bumped up to a fresh two-month-high over the weekend as both Cuban and Musk continue to elicit a lot of attention in the space. Prior resistance presents support potential, and this plots around the 61.8% Fibonacci retracement at .2831.
Dogecoin/USD (DOGE/USD) Daily Price Chart
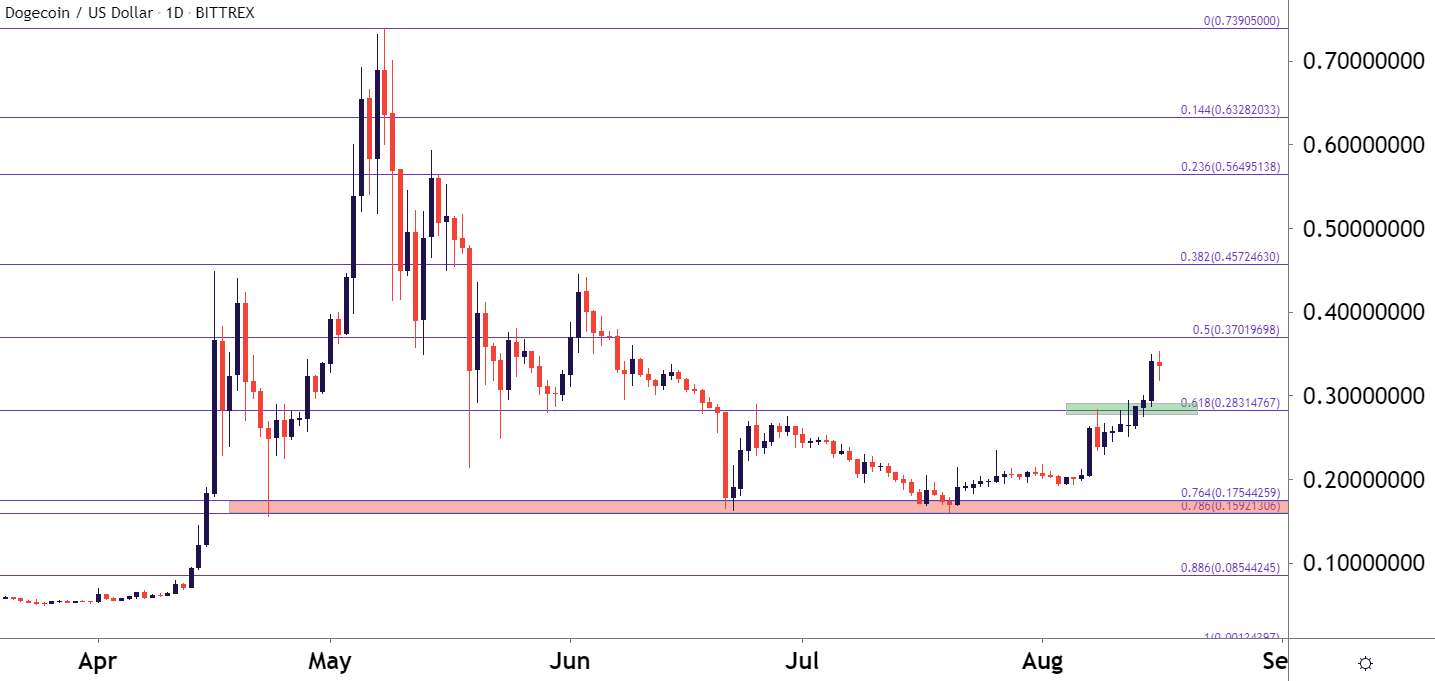
Chart prepared by James Stanley; Dogecoin on Tradingview
Bitcoin Gearing Up for a Go at 50?
In a relatively young market like cryptocurrencies, simple technical analysis can bring some interesting observations. Psychological levels fits here, as these rounded whole levels will often have a tendency to elicit a reaction even in those that aren’t aware that they’re using a form of technical analysis. The most recent illustration of this premise would be the three months and multiple inflections of support that built in at that 30k level before buyers went to work a few weeks ago.
That bullish trend has finally found some element of resistance, and this shows in an area of prior support from Feb-May, just as Bitcoin was testing the ground above the 60k level.
The big price looming overhead is the 50k marker; and while Bitcoin did break out there in February, the move was unable to hold as that breakout led to an erratic three-month-pattern before prices finally broke down, helped along by Tesla’s announcement that they would stop accepting the cryptocurrency due to energy concerns.
On a near-term basis, support is showing around prior resistance, plotted at a Fibonacci projection level at 46,433.
Bitcoin (BTC/USD) Daily Price Chart
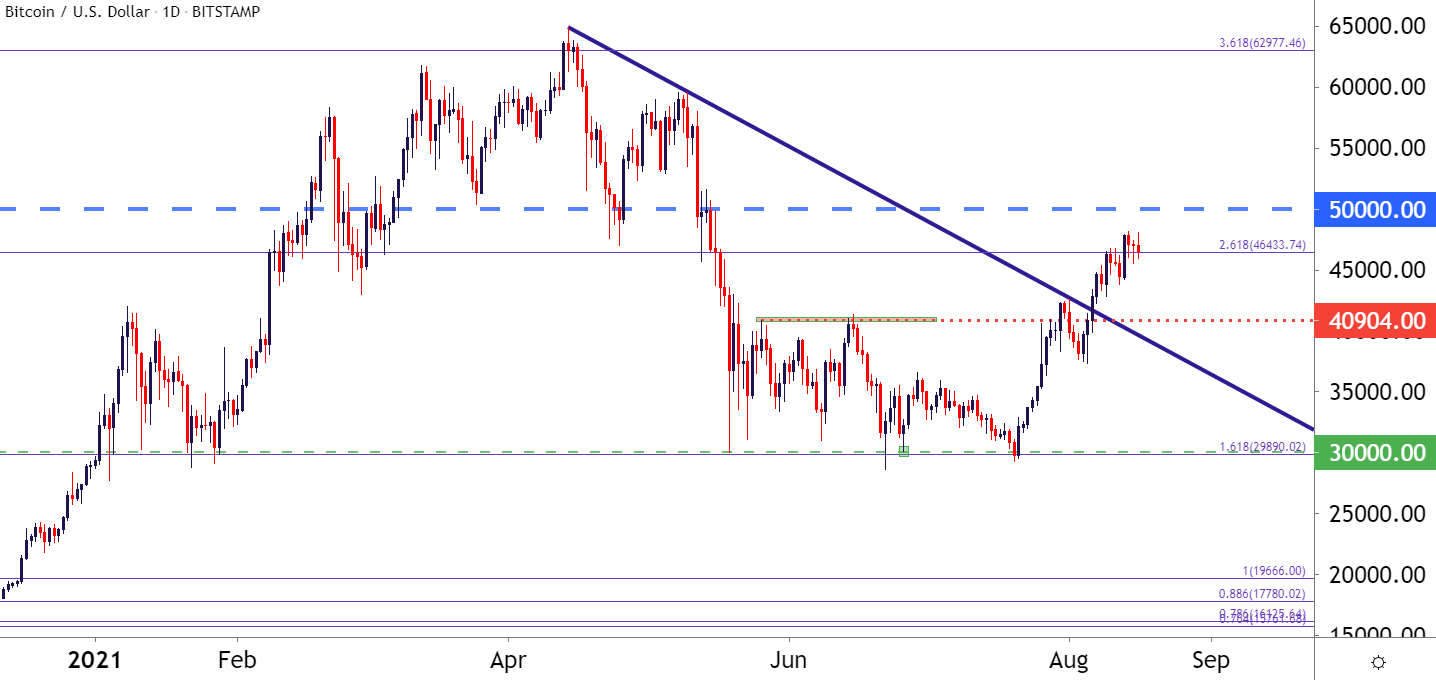
Chart prepared by James Stanley; Bitcoin on Tradingview
Ethereum Builds Pressure, Ether Breakout Potential
Ethereum’s +80% run off of the lows remains notable and while ETH/USD has similarly met some resistance, there appears to be continued potential here as prices are now finding support at prior resistance.
The level of note is 3190, which first came back into the picture last week, helping to set the high before prices pulled back for support at prior resistance. And that high held through last week’s trade until bulls were finally able to force a breakout on Friday.
That breakout pulled back over the weekend, finding support above 3100, and a recurrent support test has found support around that 3190 spot.
This keeps the door open for bullish breakout scenarios in Ethereum.
Ethereum (ETH/USD) Daily Price Chart
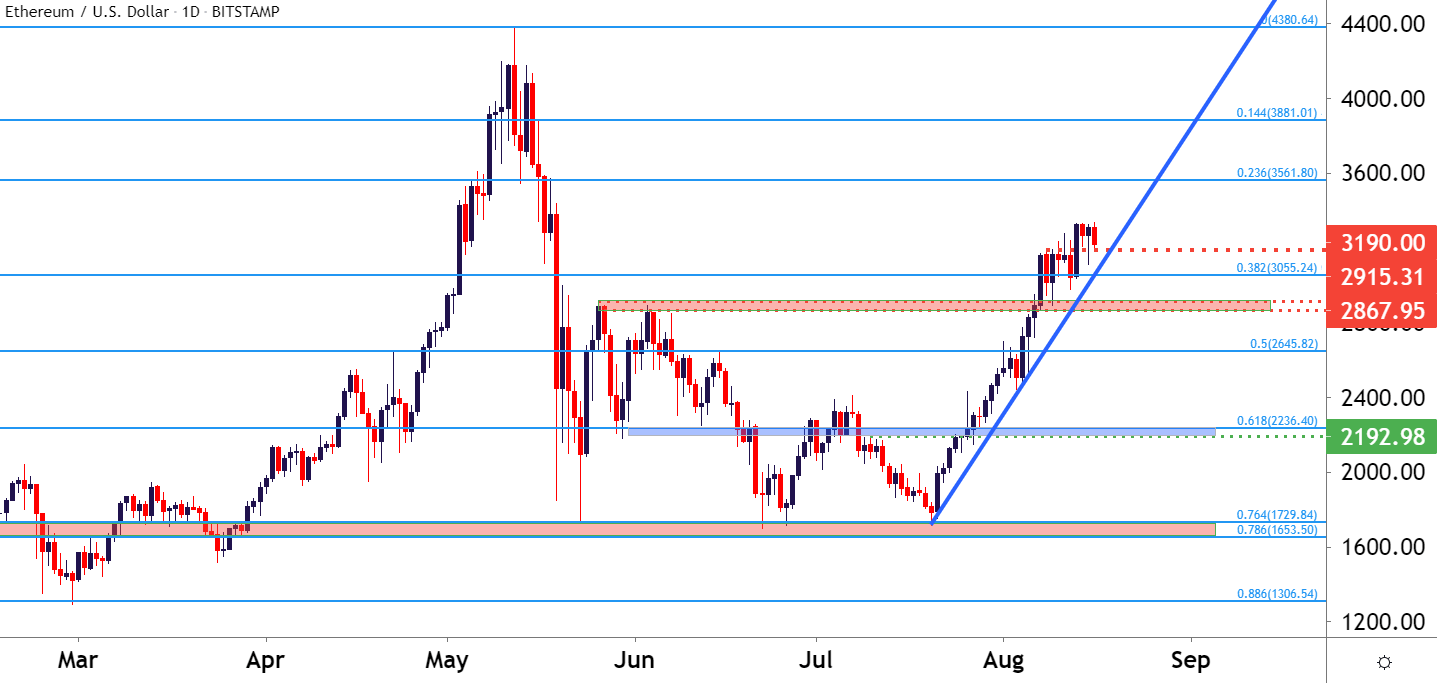
Chart prepared by James Stanley; Ethereum on Tradingview
— Written by James Stanley, Senior Strategist for DailyFX.com
Contact and follow James on Twitter: @JStanleyFX


