


- Weekly oscillator levels show clear rejection higher.
- Mixed divergence signals warn of deeper moves south.
- Cardano is likely to break the $2.00 range.
Cardano’s been one of the best performers of 2021 and the upcoming Alonzo upgrade has yielded intense interest. However, most of that bullish fundamental news is likely priced in. Upside momentum towards the $5 and $8 ranges remain, but a retest lower is expected as necessary to continue the broader bullish trend.
Cardano likely to test and trade below $2
Cardano price is on track to continue the downward trend and movement that began on Tuesday. The weekly Kijun-Sen acted as the precise low of the flash crash earlier in the week and should be expected to act as solid support again. A deeper move, though, should be expected. There is a massive gap between the current close and the Tenkan-Sen on the monthly chart.
The monthly Tenkan-Sen sits at $1.62, just below the 61.8% Fibonacci retracement at $1.77. $1.62 is the upper range of the high volume node in the volume profile that makes up the 2021 VPOC.
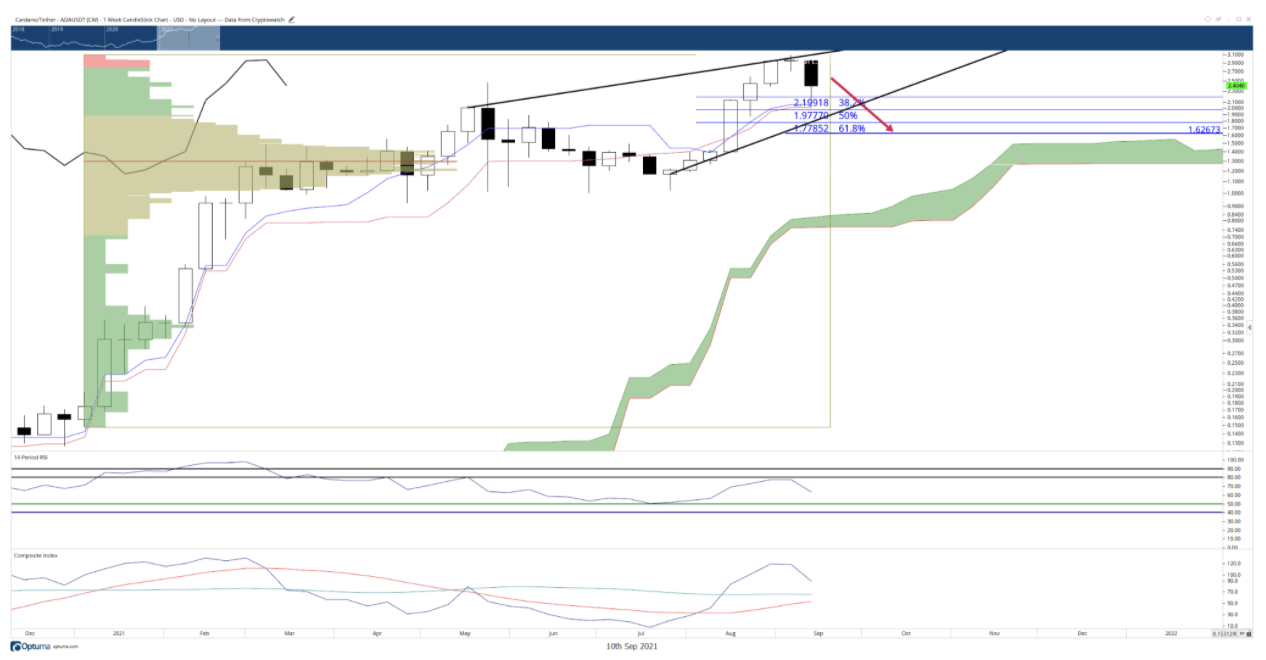
ADA/USDT Weekly Chart
Bears need to be cautious if Cardano does move lower and hits the weekly Tenkan-Sen and Kijun-Sen in the $2.00 value area. However, strong support could develop here. If Cardano is trading in the $2.00 around the Alonzo release date on September 12th, it could be a launching pad for new all-time highs. This will be especially true if the Relative Strenght Index is trading near the 40 or 50 level if Cardano is trading near the $2.00 value area.
Bulls and bears will want to pay special attention to the volume profile for any major accumulation zones that hint at new floors and ceiling development. Likely, any new central high volume nodes that appear between $2.30 and $2.70 will be the new ‘lows’ for the foreseeable future.


