


BeInCrypto takes a look at the seven altcoins that increased the most over the past seven days, from Oct 1 to 8.
These altcoins are:
- SHIBA INU (SHIB) : 204.62%
- Fantom (FTM) : 67.18%
- Axie Infinity (AXS) : 56.67%
- Klaytn (KLAY) : 38.99%
- Arweave (AR) : 37.69%
- Harmony (ONE) : 36.28%
- Bitcoin SV (BSV) : 34.08%
SHIB
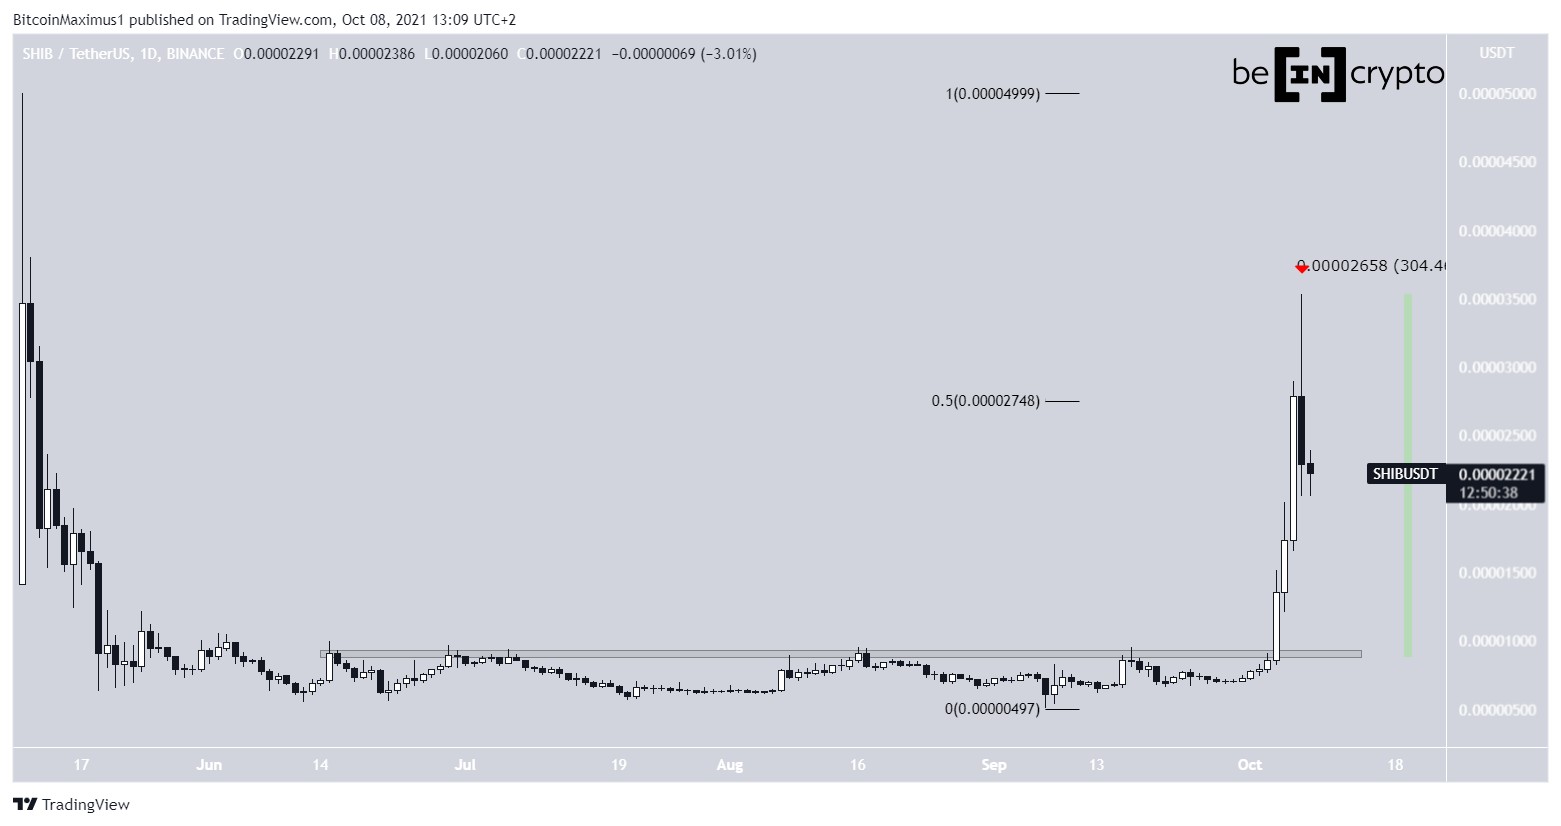
SHIB consolidated below the $0.000009 resistance n the period from June 13 to Oct 4. Such long periods of consolidation are often followed by a decisive movement once a breakout or breakdown occurs.
Unsurprisingly, a massive breakout transpired on Oct 4 when SHIB created a large bullish candlestick. Afterwards, in a span of only four days, the token increased by 304%
However, the higher prices could not be sustained and the token created a long upper wick (red icon). This is a sign of selling pressure, indicating that sellers have taken over, at least in the short-term. The fact that the candle was created right at the 0.5 Fib retracement resistance level further solidifies its significant.
Currently, the token is retracing, attempting to find support.

FTM
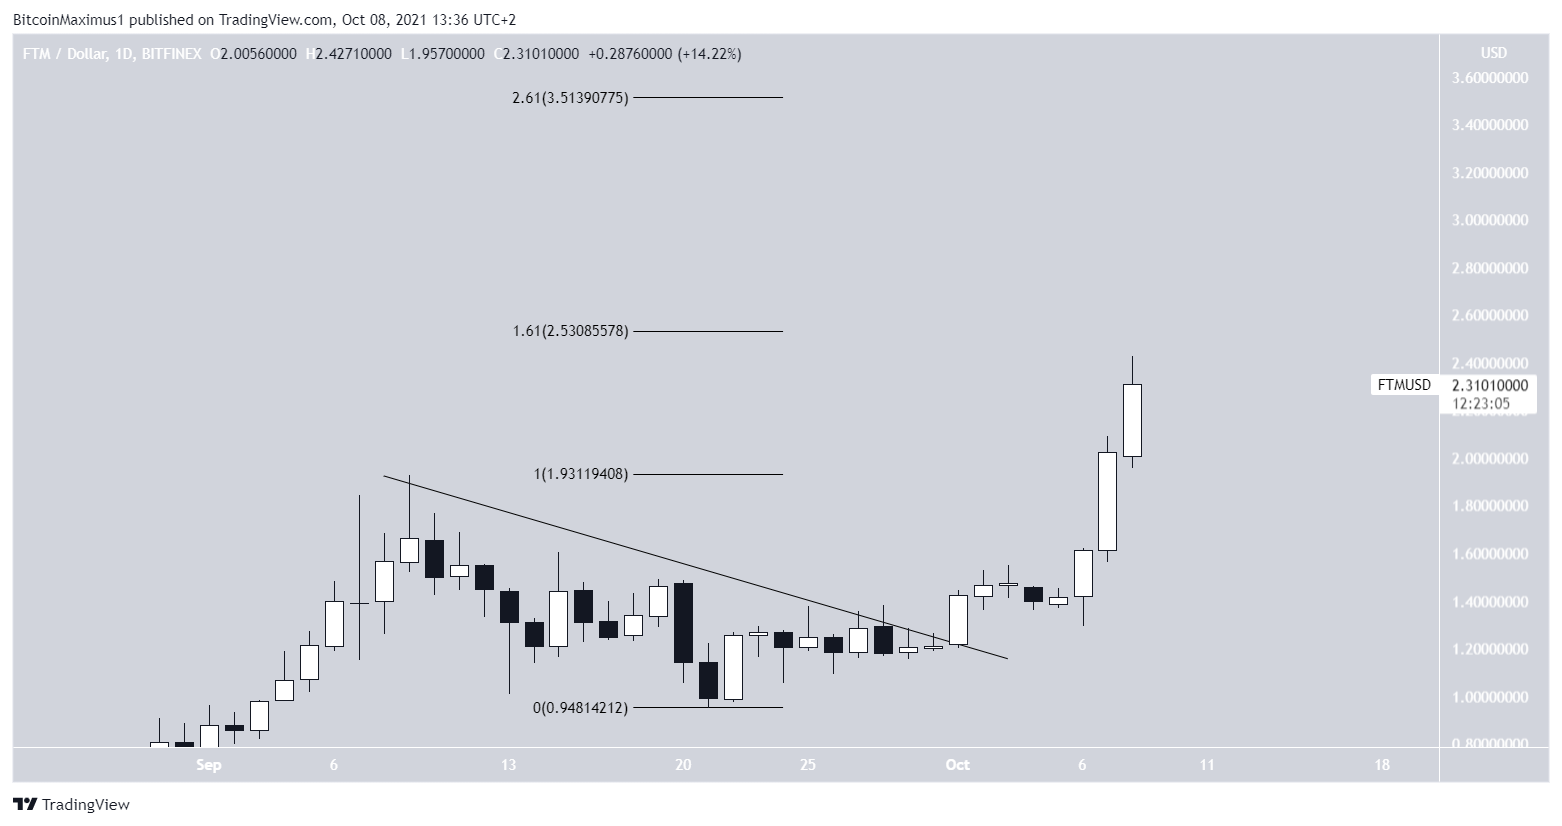
FTM has been moving upwards since Sept 21. On Oct 1, it broke out from a descending resistance line, indicating that the previous downward movement had come to an end. Since the breakout it has been increasing at a rapid pace.
On Oct 7, it reached a new all-time high price and followed that with yet another all-time high of $2.42 the next day.
The next closest resistance levels are at $2.53 and $3.51. These are the 1.61 and 2.61 external Fib retracement resistance levels. Whenever a new all-time high is reached, such levels are used to determine the next resistance areas.

AXS
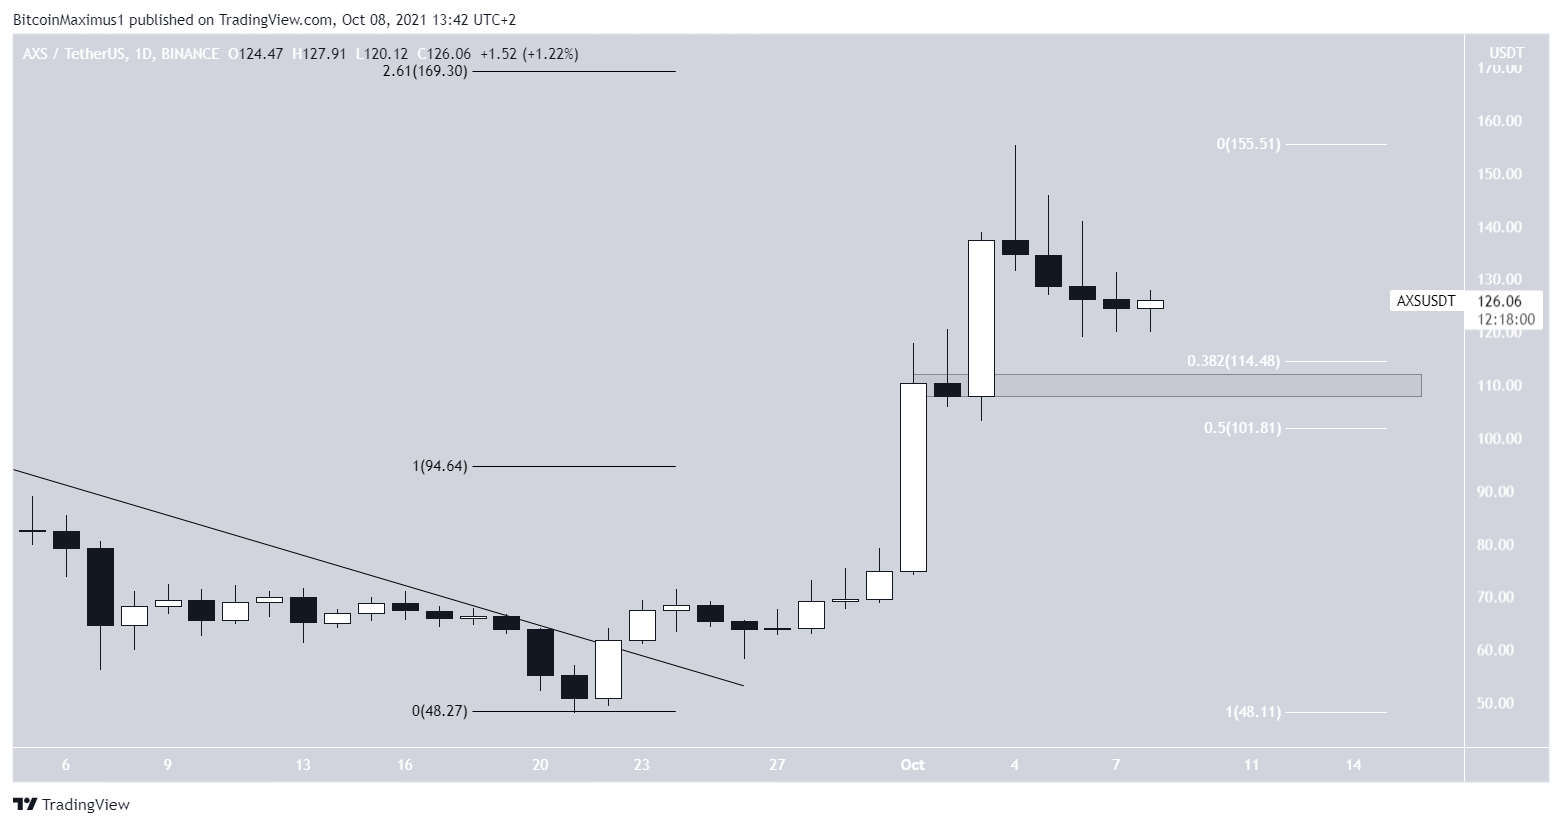
The movement of AXS is eerily similar to that of FTM. It has been moving upwards at an accelerated rate since breaking out from a descending resistance line on Sept 23, putting an end to the previous correction.
So far, the token has reached an all-time high price of $155 on Oct 4. However, the same day, it created a shooting star candlestick. This is a bearish candlestick with a very long upper wick, which indicates that sellers are currently in control. Unsurprisingly, AXS has been decreasing since.
The closest support area is between $102-$115. This is created by the 0.382-0.5 Fib retracement levels, and is a common area for corrections to end. Furthermore, it is a horizontal resistance area.
On the other hand, the next closest resistance area is at $169.
KLAY
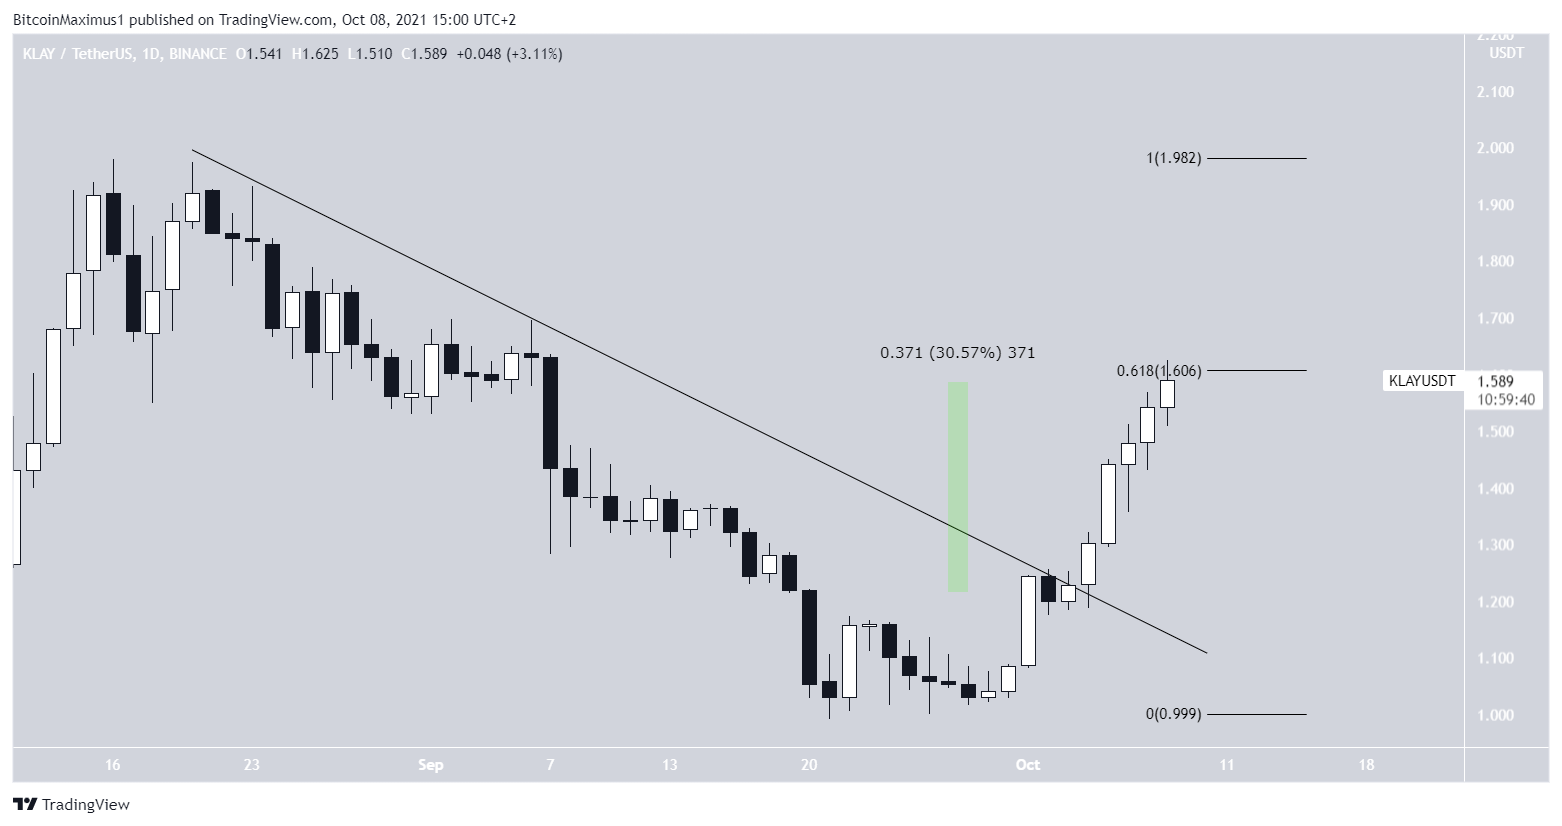
KLAY had been decreasing alongside a descending resistance line since Aug 20. This was a sign that the trend is bearish.
However, after reaching a low of $0.99 on Sept 21, the tend reversed and the token broke out from the descending resistance line on Oct 4. Since then, it has moved upward by 30%.
However, it is currently facing resistance at $1.60, the 0.618 Fib retracement resistance level. This is the most common resistance level created by the Fib retracement tool.
Once it moves above it, it can aim for the all-time high price at $1.98.
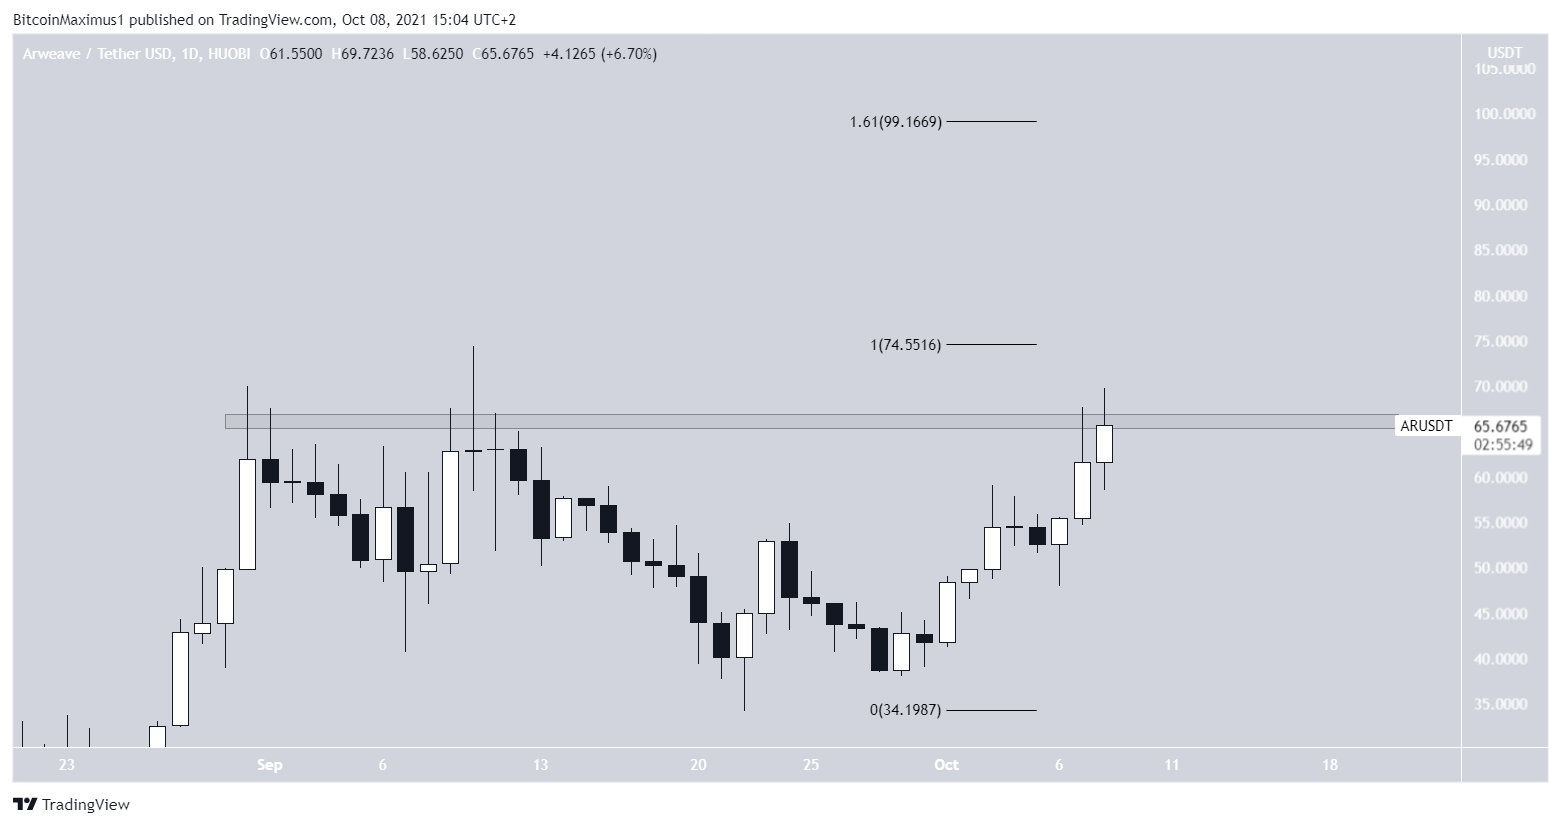
AR
AR has been moving upwards since Sept 22. Currently, it is very close to reaching a new all0-time high, but it is struggling with the $66 resistance area.
Nevertheless, each time a level is touched, it becomes weaker. Since this is the third attempt at moving above $66, a breakout seems likely.
If one occurs, the next resistance level would be at $99, created by the 1.61 external Fib level. While the all-time high is at $74.55, the level is not considered resistance since it only came in the form of a wick.
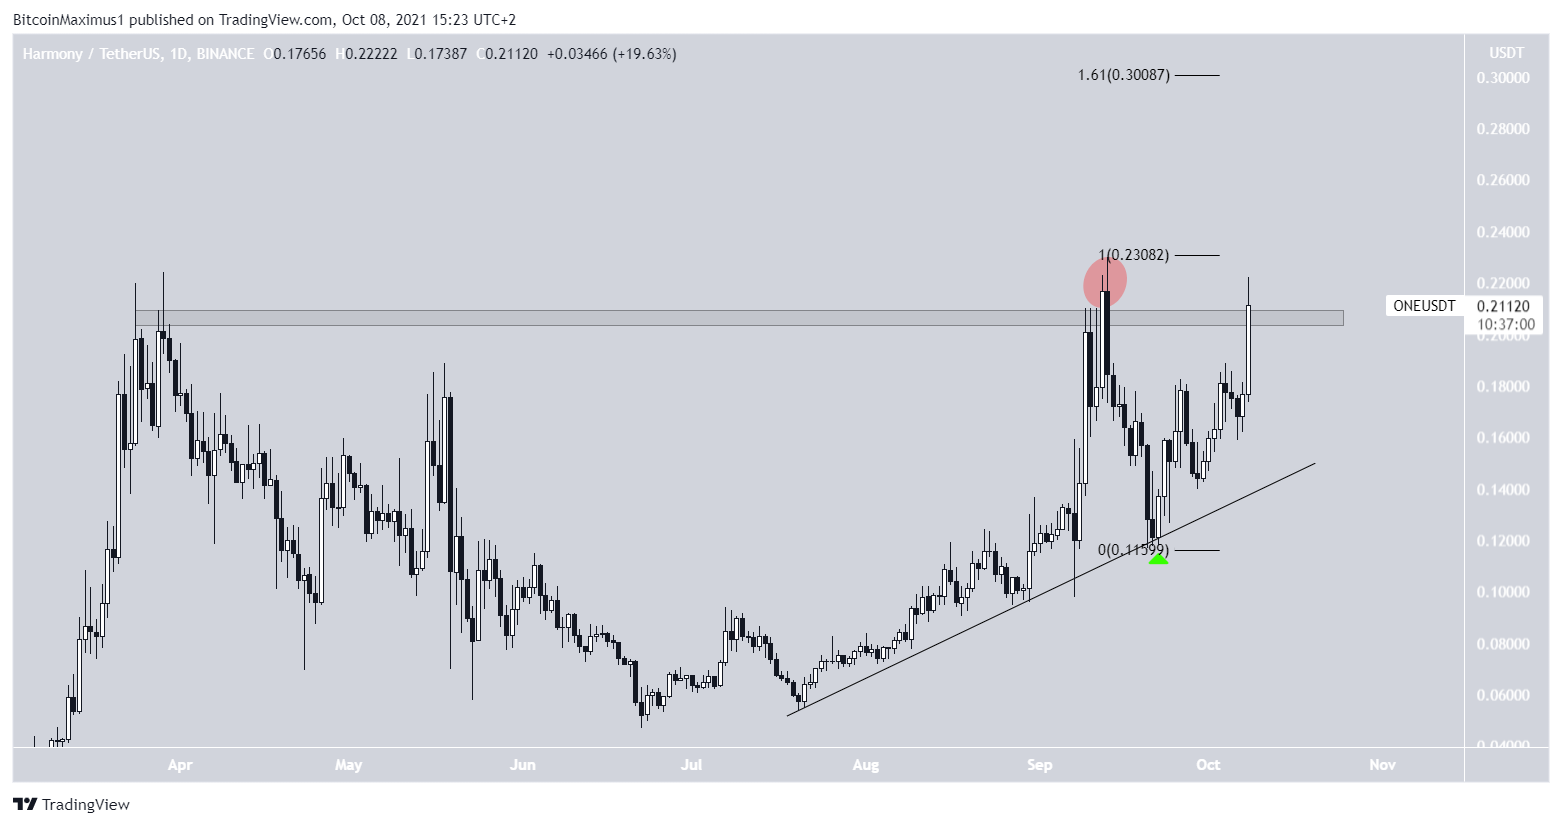
ONE
ONE has been increasing alongside an ascending support line since July 20. On Sept 13, it reached a new all-time high price of $0.229. However, the breakout turned out be be only a deviation (red circle), since the token fell below the $0.20 resistance area afterwards.
However, it bounced at the support line once more on Sept 21 (green icon). This strengthened the validity of the support line, since the price reacted to it even after such a sharp fall.
Afterwards, it initiated another upward movement and is currently in the process of breaking out from the $0.20 area.
If it is successful in moving above it, the next resistance would be at $0.30.
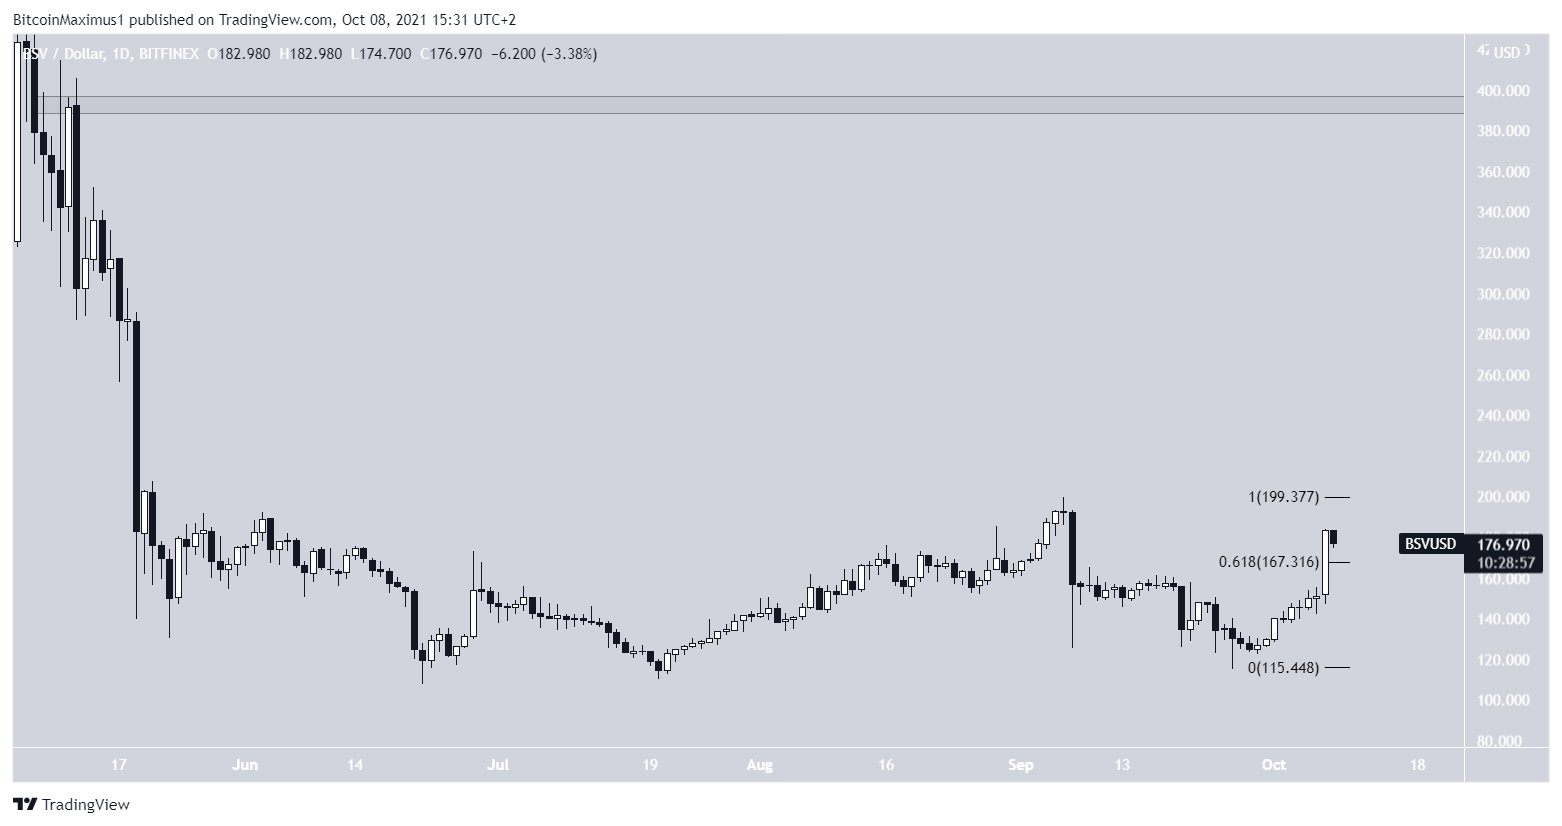
BSV
BSV has been lagging considerably in relation to other altcoins, since it has yet to move above its Sept highs.
However, it created a large bullish candlestick on Oct 7 and moved above the 0.618 Fib retracement resistance level of $167.
Therefore, there is no resistance left until the Sept highs at $200.
If BSV manages to clear this level, there is virtually no resistance until $400.
For BeInCrypto’s latest Bitcoin (BTC) analysis, click here.
What do you think about this subject? Write to us and tell us!
Disclaimer
All the information contained on our website is published in good faith and for general information purposes only. Any action the reader takes upon the information found on our website is strictly at their own risk.


