


According to on-chain data, Bitcoin miners seem to be holding off on selling BTC despite the recent rally where the coin has crossed $57k.
Bitcoin Miner Reserves Continue To Move Sideways
As pointed out by a CryptoQuant post, BTC miner reserves continue to trend sideways amid the coin’s strong move up.
The “miner reserve” is a indicator that shows the total amount of Bitcoin that miners are currently holding in their wallets.
An increase in the metric’s value suggests miners think the coin’s value will go up in the near future, hence they are stocking up on it.
While a decrease would mean they are taking their profits as they expect a correction or bear market in the future.
Related Reading | Why A Parabolic Move Is Expected For Bitcoin, Billionaire Mike Novogratz
Here is a chart showing the trend in the value of this indicator versus the BTC price over the last year:
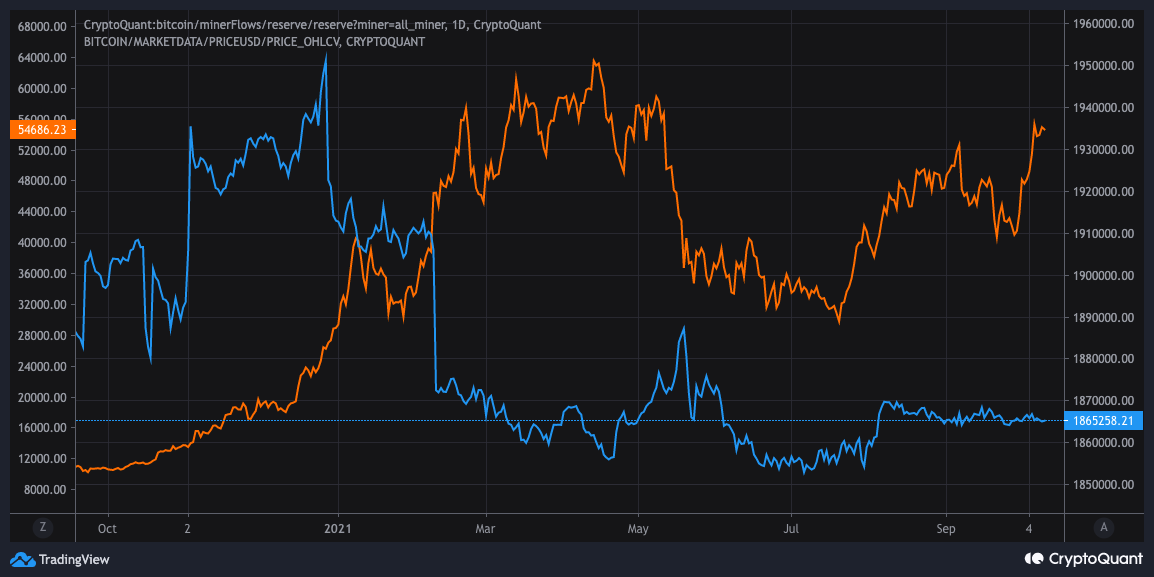
The BTC miner reserve seems to be treading sideways | Source: CryptoQuant
As the above graph shows, the indicator’s value has been moving rather sideways recently, despite the sharp move up in Bitcoin’s price.
Generally, such a move implies miners are either neutral or bullish about the crypto. Many of them are still taking out some coins, while others are adding back in similar amounts. This is why the reserve is looking very balanced at the moment.
Related Reading | Why The $1 Trillion Coin Is Another Reason To Stay Long Bitcoin
On a closer look at the chart, it becomes apparent that the metric also showed a bit of sideways movement during the rally that took BTC to the current all time high (ATH).
Perhaps something similar will happen here so it can be worth keeping an eye on these miner reserves for any movements in either direction.
BTC Price
At the time of writing, Bitcoin’s price floats around $57.5k, up 22% in the last seven days. Over the last month, the crypto has accumulated 26% in gains.
The below chart shows the trend in the price of the coin over the last five days:

BTC's price shows strong movement up | Source: BTCUSD on TradingView
Bitcoin has shown a lot of volatility recently, but the price has still been showing an overall upwards trend as the coin now crosses $57k for the first time since May of this year.
It remains to be seen if the crypto can keep up this momentum and make a new ATH soon. Signs seem to be leaning positive as a supply shock now seems to be brewing in the market as shown by the exchange reserves of the coin that have fallen down to lows not seen since October 2017.
Featured image from Unsplash.com, chart from TradingView.com


