


Bitcoin (CRYPTO: BTC), Ethereum (CRYPTO: ETH) and Dogecoin (CRYPTO: DOGE) are all trading higher in strong uptrends. An uptrend occurs when a stock consistently makes a series of higher highs and higher lows on the chart.
The higher highs indicate the bulls are in control, while the intermittent higher lows indicate consolidation periods. Traders can use moving averages to help identify an uptrend, with rising lower timeframe moving averages (such as the eight-day or 21-day exponential moving averages) indicating the stock is in a steep shorter-term uptrend and rising longer-term moving averages (such as the 200-day simple moving average) indicating a long-term uptrend.
A stock often signals when the higher high is in by printing a reversal candlestick such as a doji, bearish engulfing or hanging man candlestick. Likewise, the higher low could be signaled when a doji, morning star or hammer candlestick is printed. Moreover, the higher highs and higher lows often take place at resistance and support levels.
In an uptrend the “trend is your friend” until it’s not, and in an uptrend there are ways for both bullish and bearish traders to participate in the stock:
- Bullish traders who are already holding a position in a stock can feel confident the uptrend will continue unless the stock makes a lower low. Traders looking to take a position in a stock trading in an uptrend can usually find the safest entry on the higher low.
- Bearish traders can enter the trade on the higher high and exit on the pullback. These traders can also enter when the uptrend breaks and the stock makes a lower low, indicating a reversal into a downtrend may be in the cards.
See Also: McDonald’s Teases ‘Something’s Coming’ And Elon Musk Reacts: Is Doge Payment In The Cards?
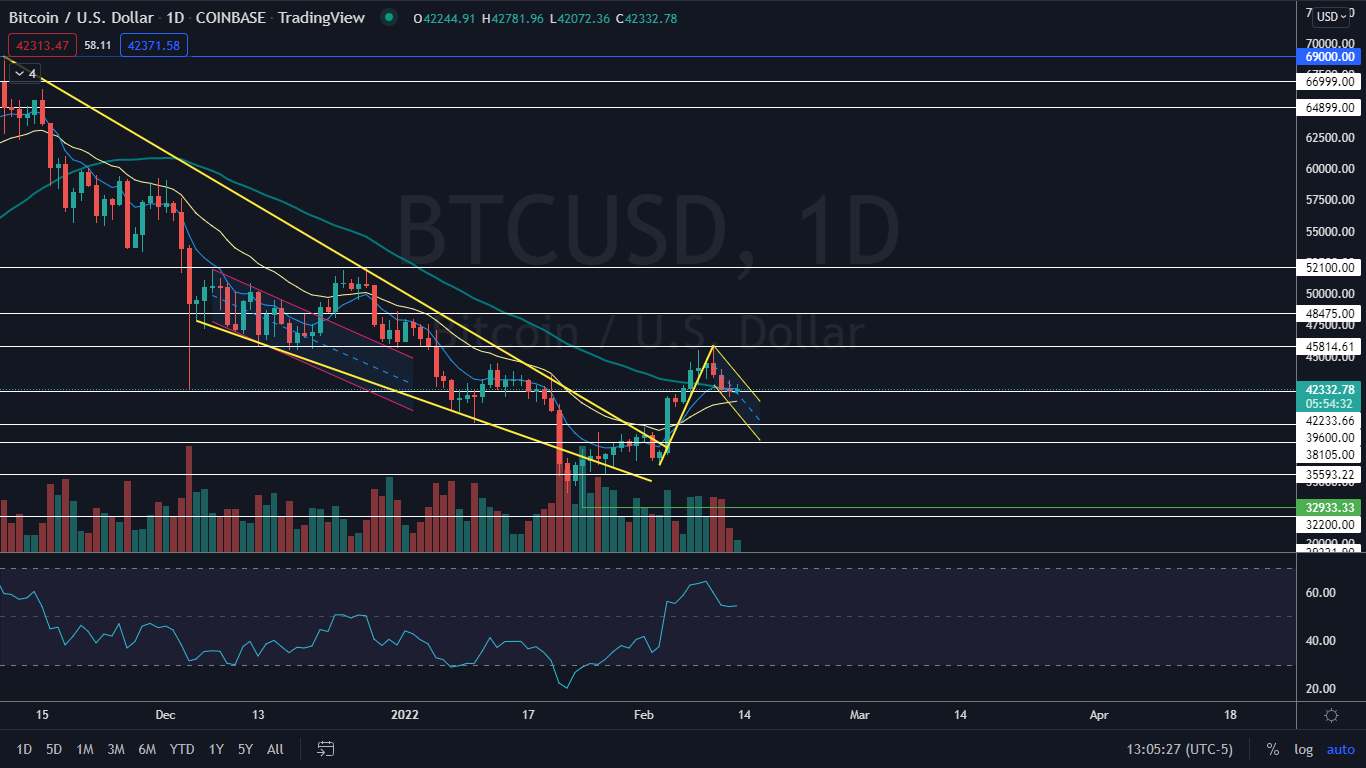
The Bitcoin Chart: Bitcoin has been trading in an uptrend since Jan. 24, making a consistent series of higher highs and higher lows. The most recent higher low was printed on Feb. 3 at the $36,259 level and if the crypto remains above the level the uptrend will continue.
- Bitcoin may also be settling into a bull flag pattern on the daily chart, with the pole created between Feb. 3 and Feb. 9 and the pole formed over the days that have followed. If Bitcoin breaks up bullishly from the flag pattern on higher-than-average volume, the measured move is about 26%, which indicates Bitcoin could trade up toward $52,700.
- The bull flag will be negated if Bitcoin falls below the eight-day exponential moving average (EMA) on the daily chart.
- On Sunday, Bitcoin was trading in a very tight trading range, which indicates a period of consolidation. Consolidation periods are usually followed by a volatile movement in one direction as either bulls or bears rush in to take control.
- Bitcoin has resistance above at $45,814 and $48,475 and support below at $42,233 and $36,600.
Want direct analysis? Find me in the BZ Pro lounge! Click here for a free trial.
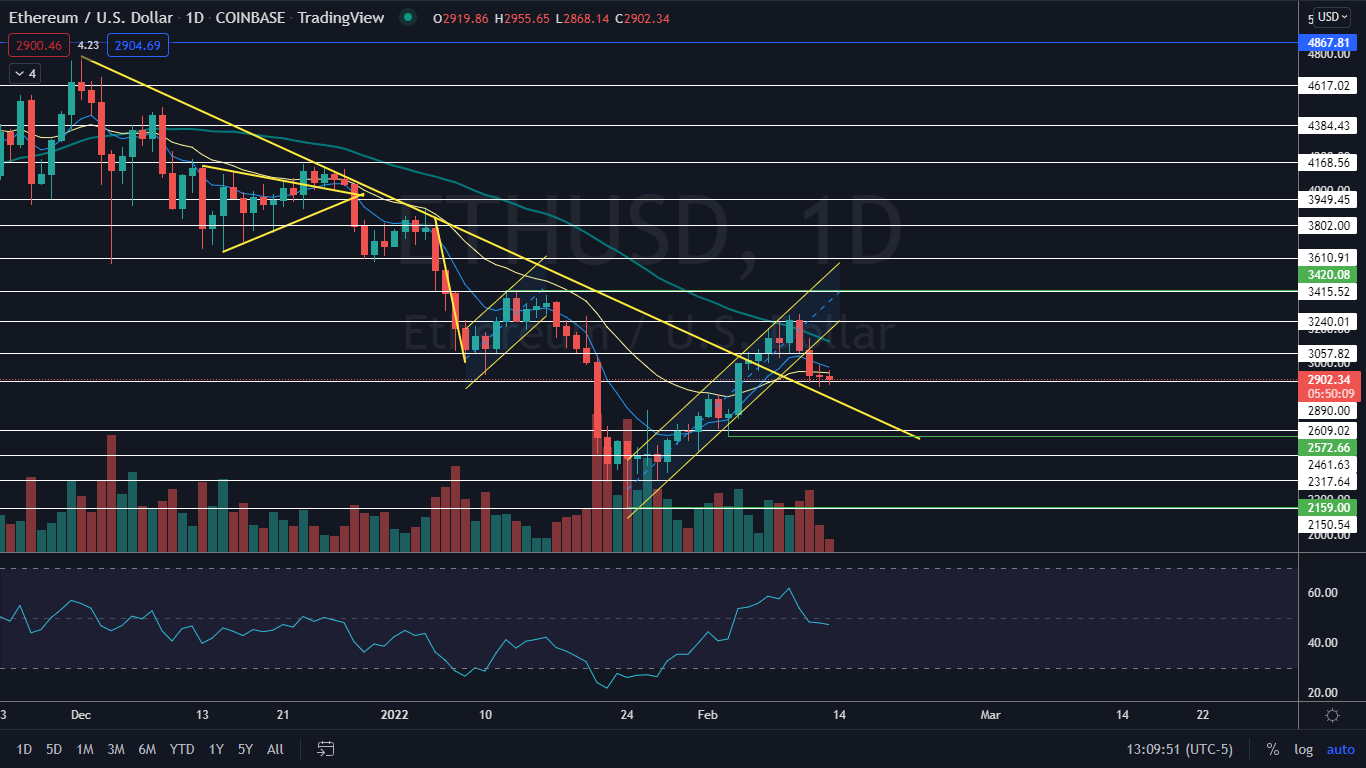
The Ethereum Chart: Like Bitcoin, Ethereum was trading in a tight low-volume range on Sunday, which indicates consolidation, while also maintaining its uptrend.
- Ethereum’s most recent higher low was printed on Feb. 3 at the $2,572.66 mark.
- The crypto has lost support at the eight-day EMA, and bullish traders will want to see Ethereum regain the level as support over the coming days to feel more confident going forward.
- Ethereum has resistance above at $3,057.82 and $3,240.01 and support below at $2,890 and $2,609.02.
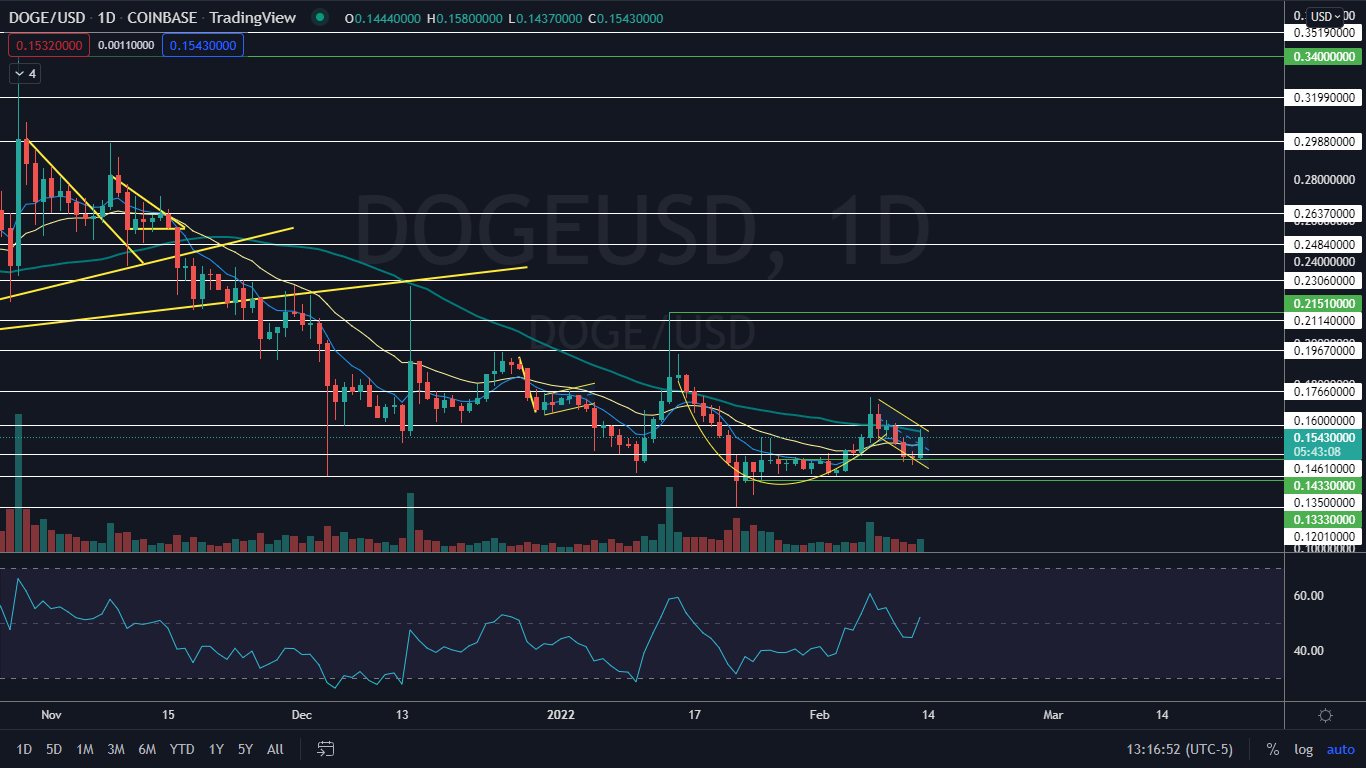
The Dogecoin Chart: Dogecoin was shooting up over 7% higher on Sunday after printing a doji candlestick on the daily chart on Saturday. The doji indicated a reversal to the upside was in the cards.
- Dogecoin’s most recent higher high was printed on Feb. 7 near the $0.173 mark, and bullish traders will want to see the crypto rise above the level over the coming days to confirm the uptrend is still intact.
- Dogecoin may also be completing the handle of a bullish cup-and-handle pattern that has been formed between Jan. 15 and today. If the crypto breaks up through the descending handle of the pattern on higher-than-average volume, the measured move is about 25%, which indicates Dogecoin could trade up toward $0.176.
- Dogecoin has resistance above at $0.16 and $176 and support below at $0.141 and $0.135.


