


Ethereum found a strong support near the $2,300 zone against the US Dollar. ETH price is rising and might rally if it clears the $2,750 resistance zone.
- Ethereum started a major recovery wave from the $2,300 support zone.
- The price is now trading above $2,500 and the 100 hourly simple moving average.
- There is a key bullish trend line forming with support near $2,520 on the hourly chart of ETH/USD (data feed via Kraken).
- The pair could continue to rise if there is a clear move above the $2,750 resistance zone.
Ethereum Price Starts Fresh Increase
Ethereum declined heavily below the $2,600 and $2,500 support levels. ETH even declined below $2,400 and tested the $2,300 zone, where the bulls appeared.
A low was formed near $2,302 and the price started a strong increase. There was a clear move above the $2,500 resistance level. Ether price even climbed above the $2,600 level and the 100 hourly simple moving average. It even spiked above the $2,700 level, but there was no break above the $2,750 resistance.
A high is formed near $2,733 and the price is now consolidating gains. It corrected lower below the 23.6% Fib retracement level of the recent increase from the $2,302 swing low to $2,733 high.
However, it is trading above $2,500 and the 100 hourly simple moving average. There is also a key bullish trend line forming with support near $2,520 on the hourly chart of ETH/USD. The first major resistance is seen near the $2,680 and $2,700 levels.
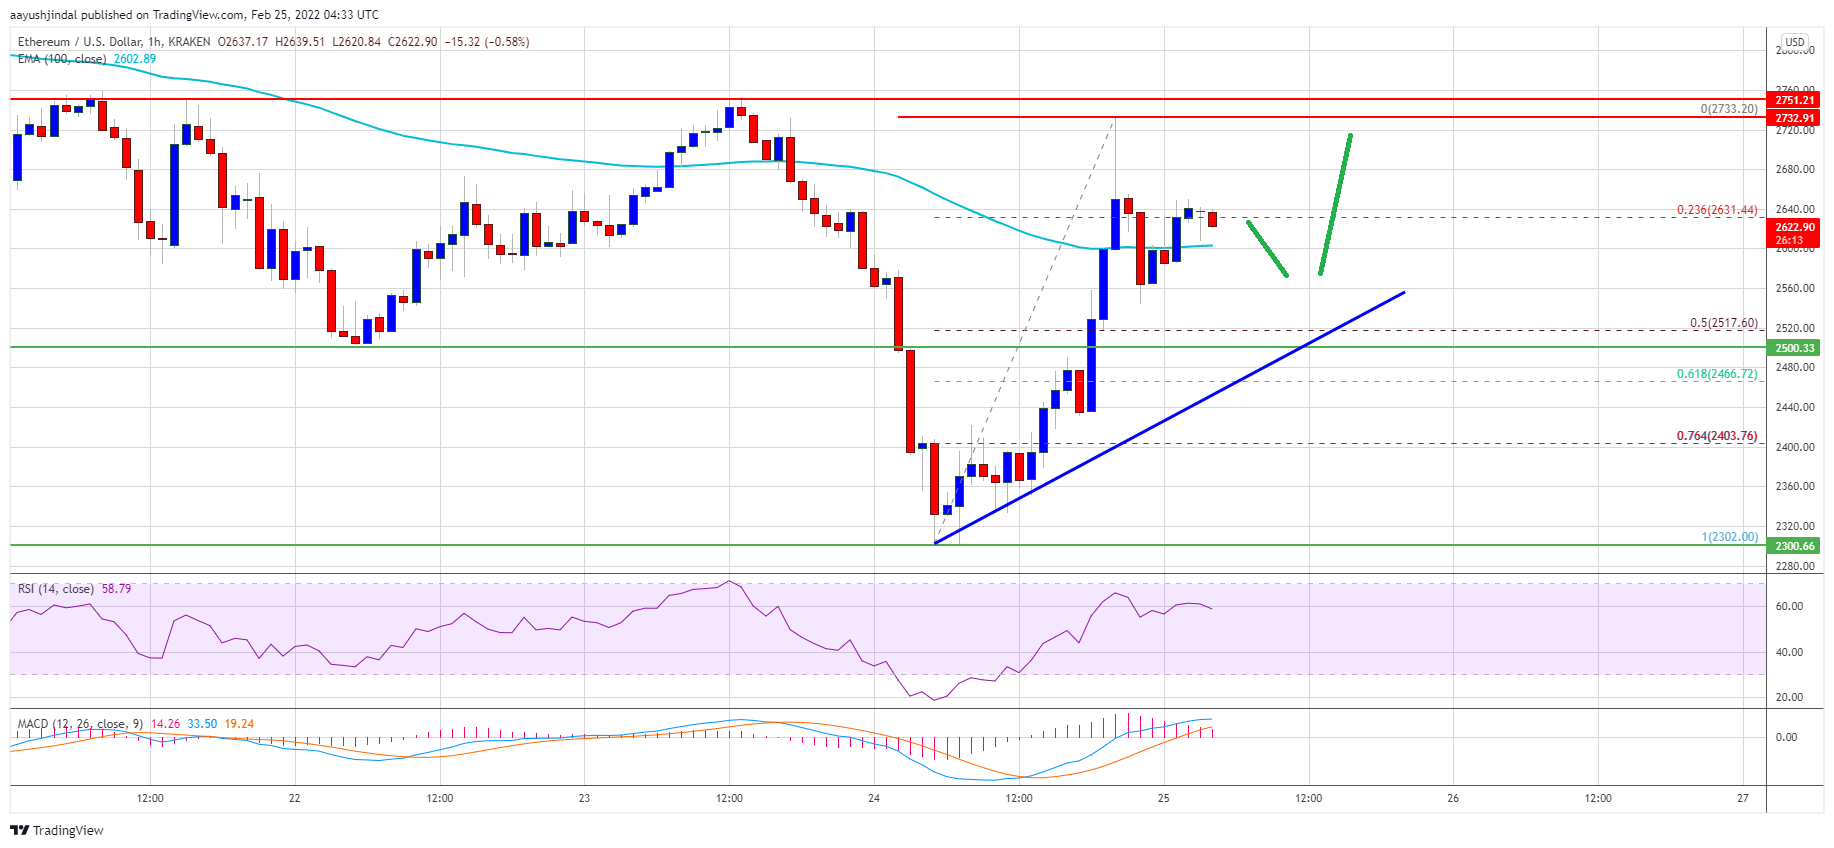
Source: ETHUSD on TradingView.com
The main resistance is now forming near the $2,750 level. A clear move above the $2,750 might start a steady increase. In the stated case, the price might even rise towards the $2,920 level.
Fresh Decline in ETH?
If ethereum fails to continue higher above the $2,750 resistance, it could start a downside correction. An initial support on the downside is near the $2,600 level.
The next major support is near the $2,500 level and the trend line. It is near the 50% Fib retracement level of the recent increase from the $2,302 swing low to $2,733 high. A downside break below the $2,500 support could push the price towards the $2,400 support level.
Technical Indicators
Hourly MACD – The MACD for ETH/USD is now losing pace in the bullish zone.
Hourly RSI – The RSI for ETH/USD is still above the 50 level.
Major Support Level – $2,500
Major Resistance Level – $2,750


