


– The Ichimoku Kinko Hyo system provides a detailed overview of any market, identifying past, present, and future time and price levels.
– Today’s analysis will cover the 3-week, weekly, and daily time frames.
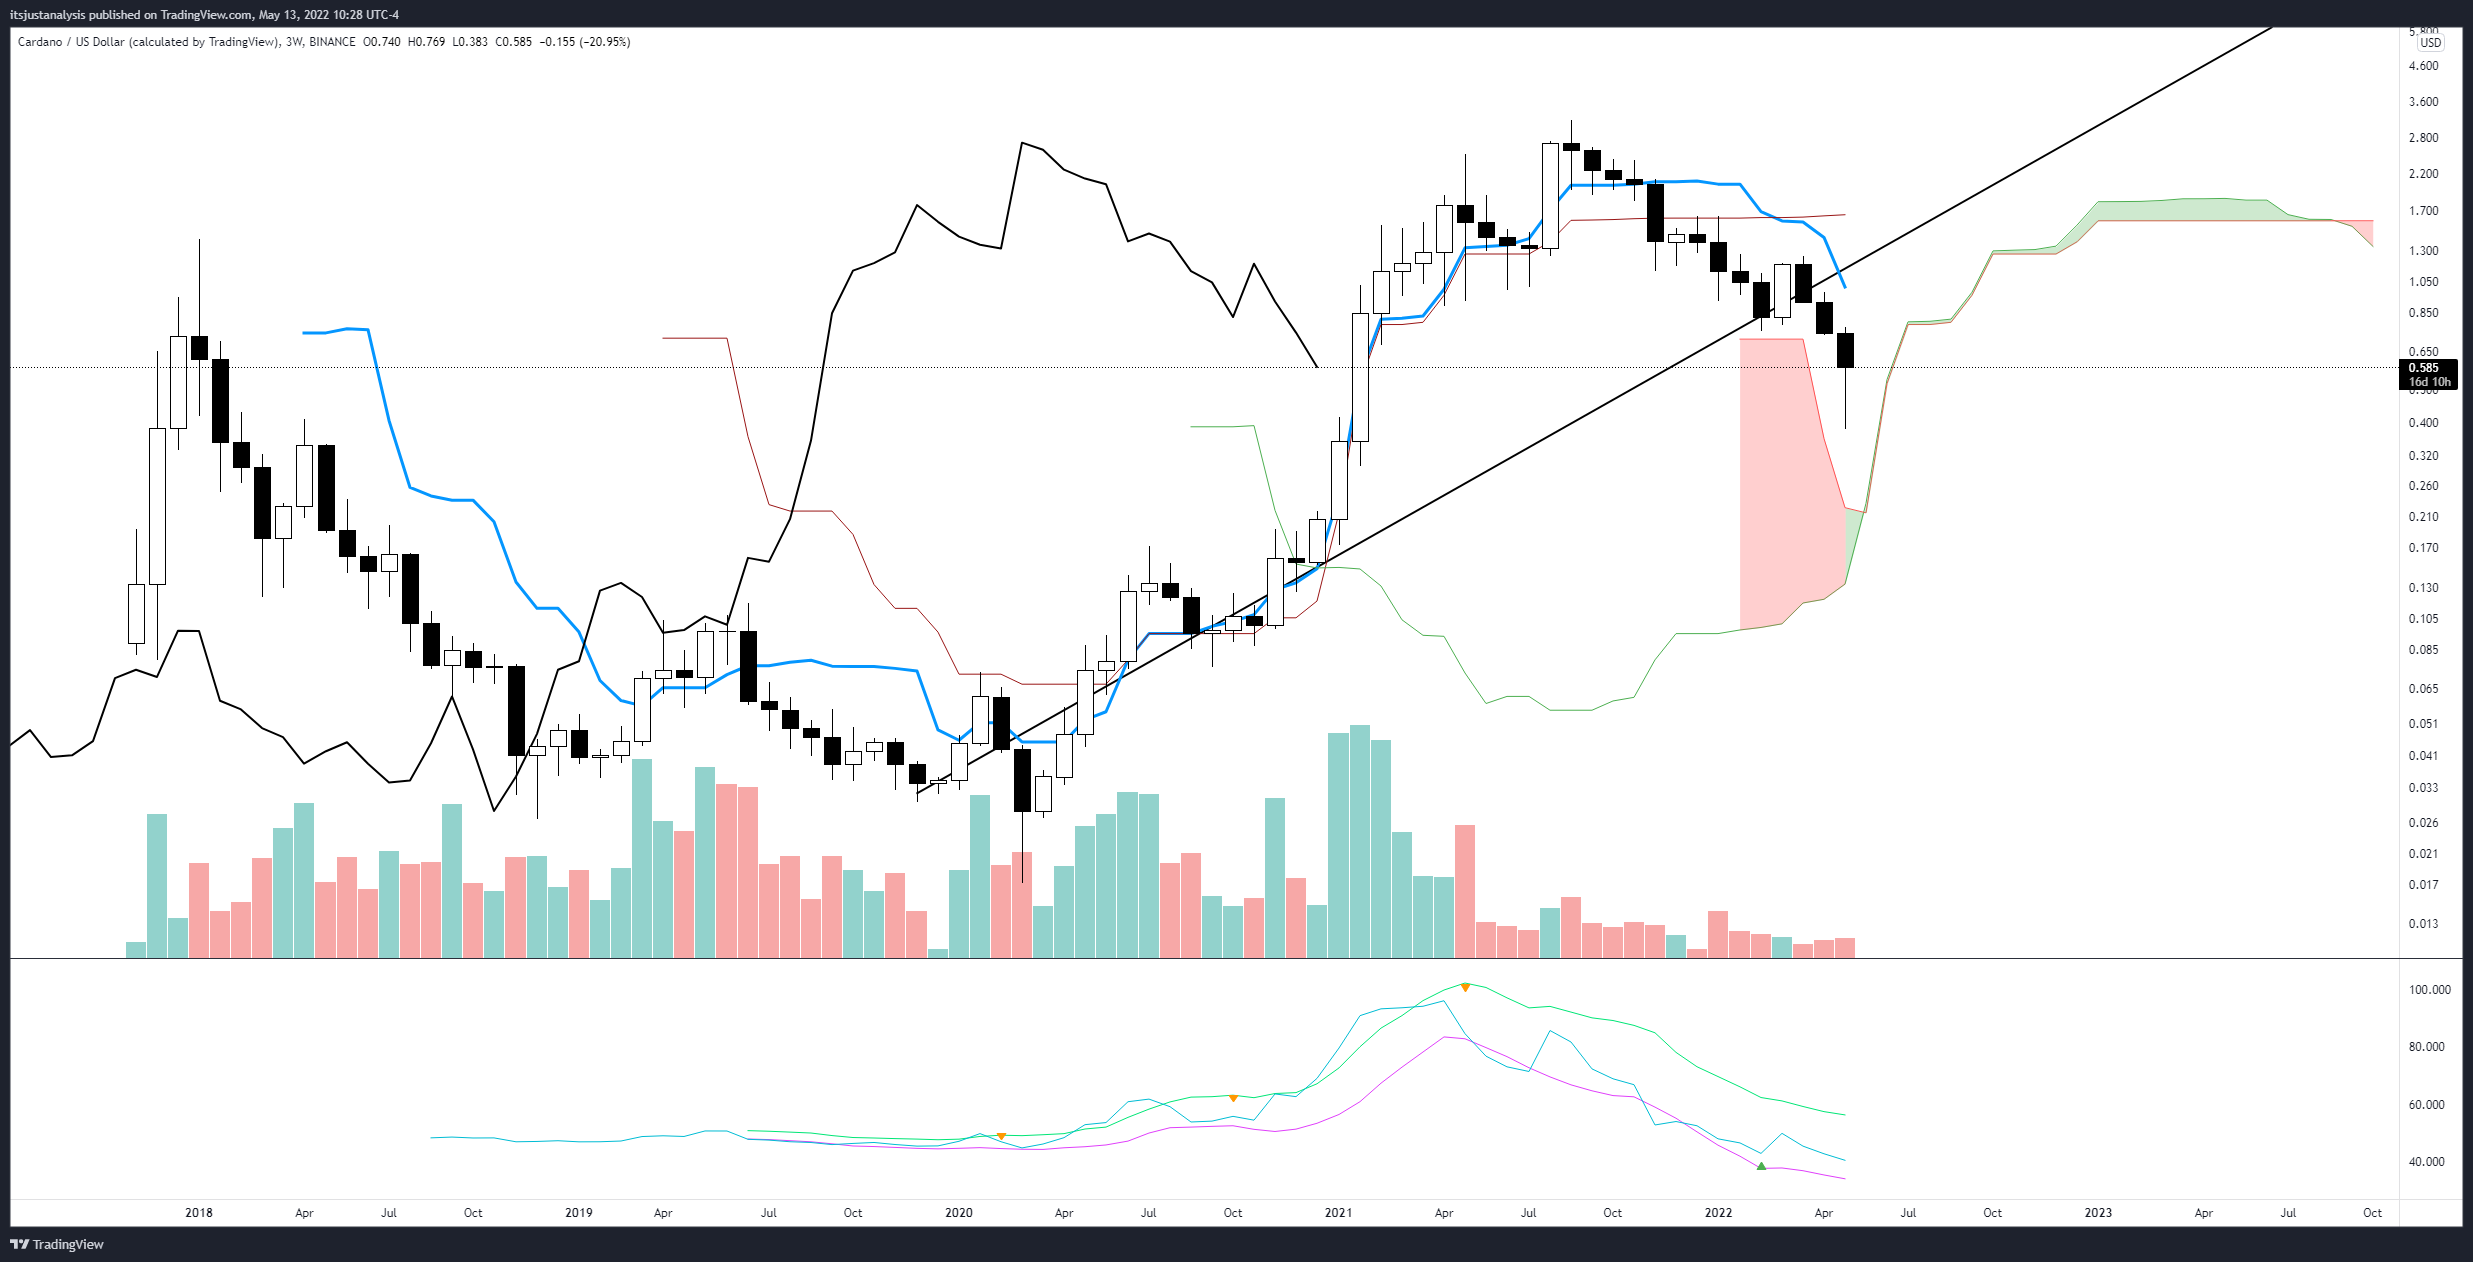
Cardano (ADA) 3-week Ichimoku Kinko Hyo Chart
 Above: Cardano (ADAUSD)
While the current slaughter in the cryptocurrency market has been impressive and depressing – depending on the side of the market you’re on – the current downtrend for Cardano is about to terminate.
Cardano remains in a clear bullish uptrend on the 3-week Ichimoku chart. ADA is above the Ichimoku Cloud, and the Chikou Span is above the candlesticks. Even more impressive is the hammer candlestick forming on the 3-week chart, which happens to coincide with a Kumo Twist.
Kumo Twists can help identify a probable swing low or high, especially if an instrument is trending into the period of the Kumo Twist.
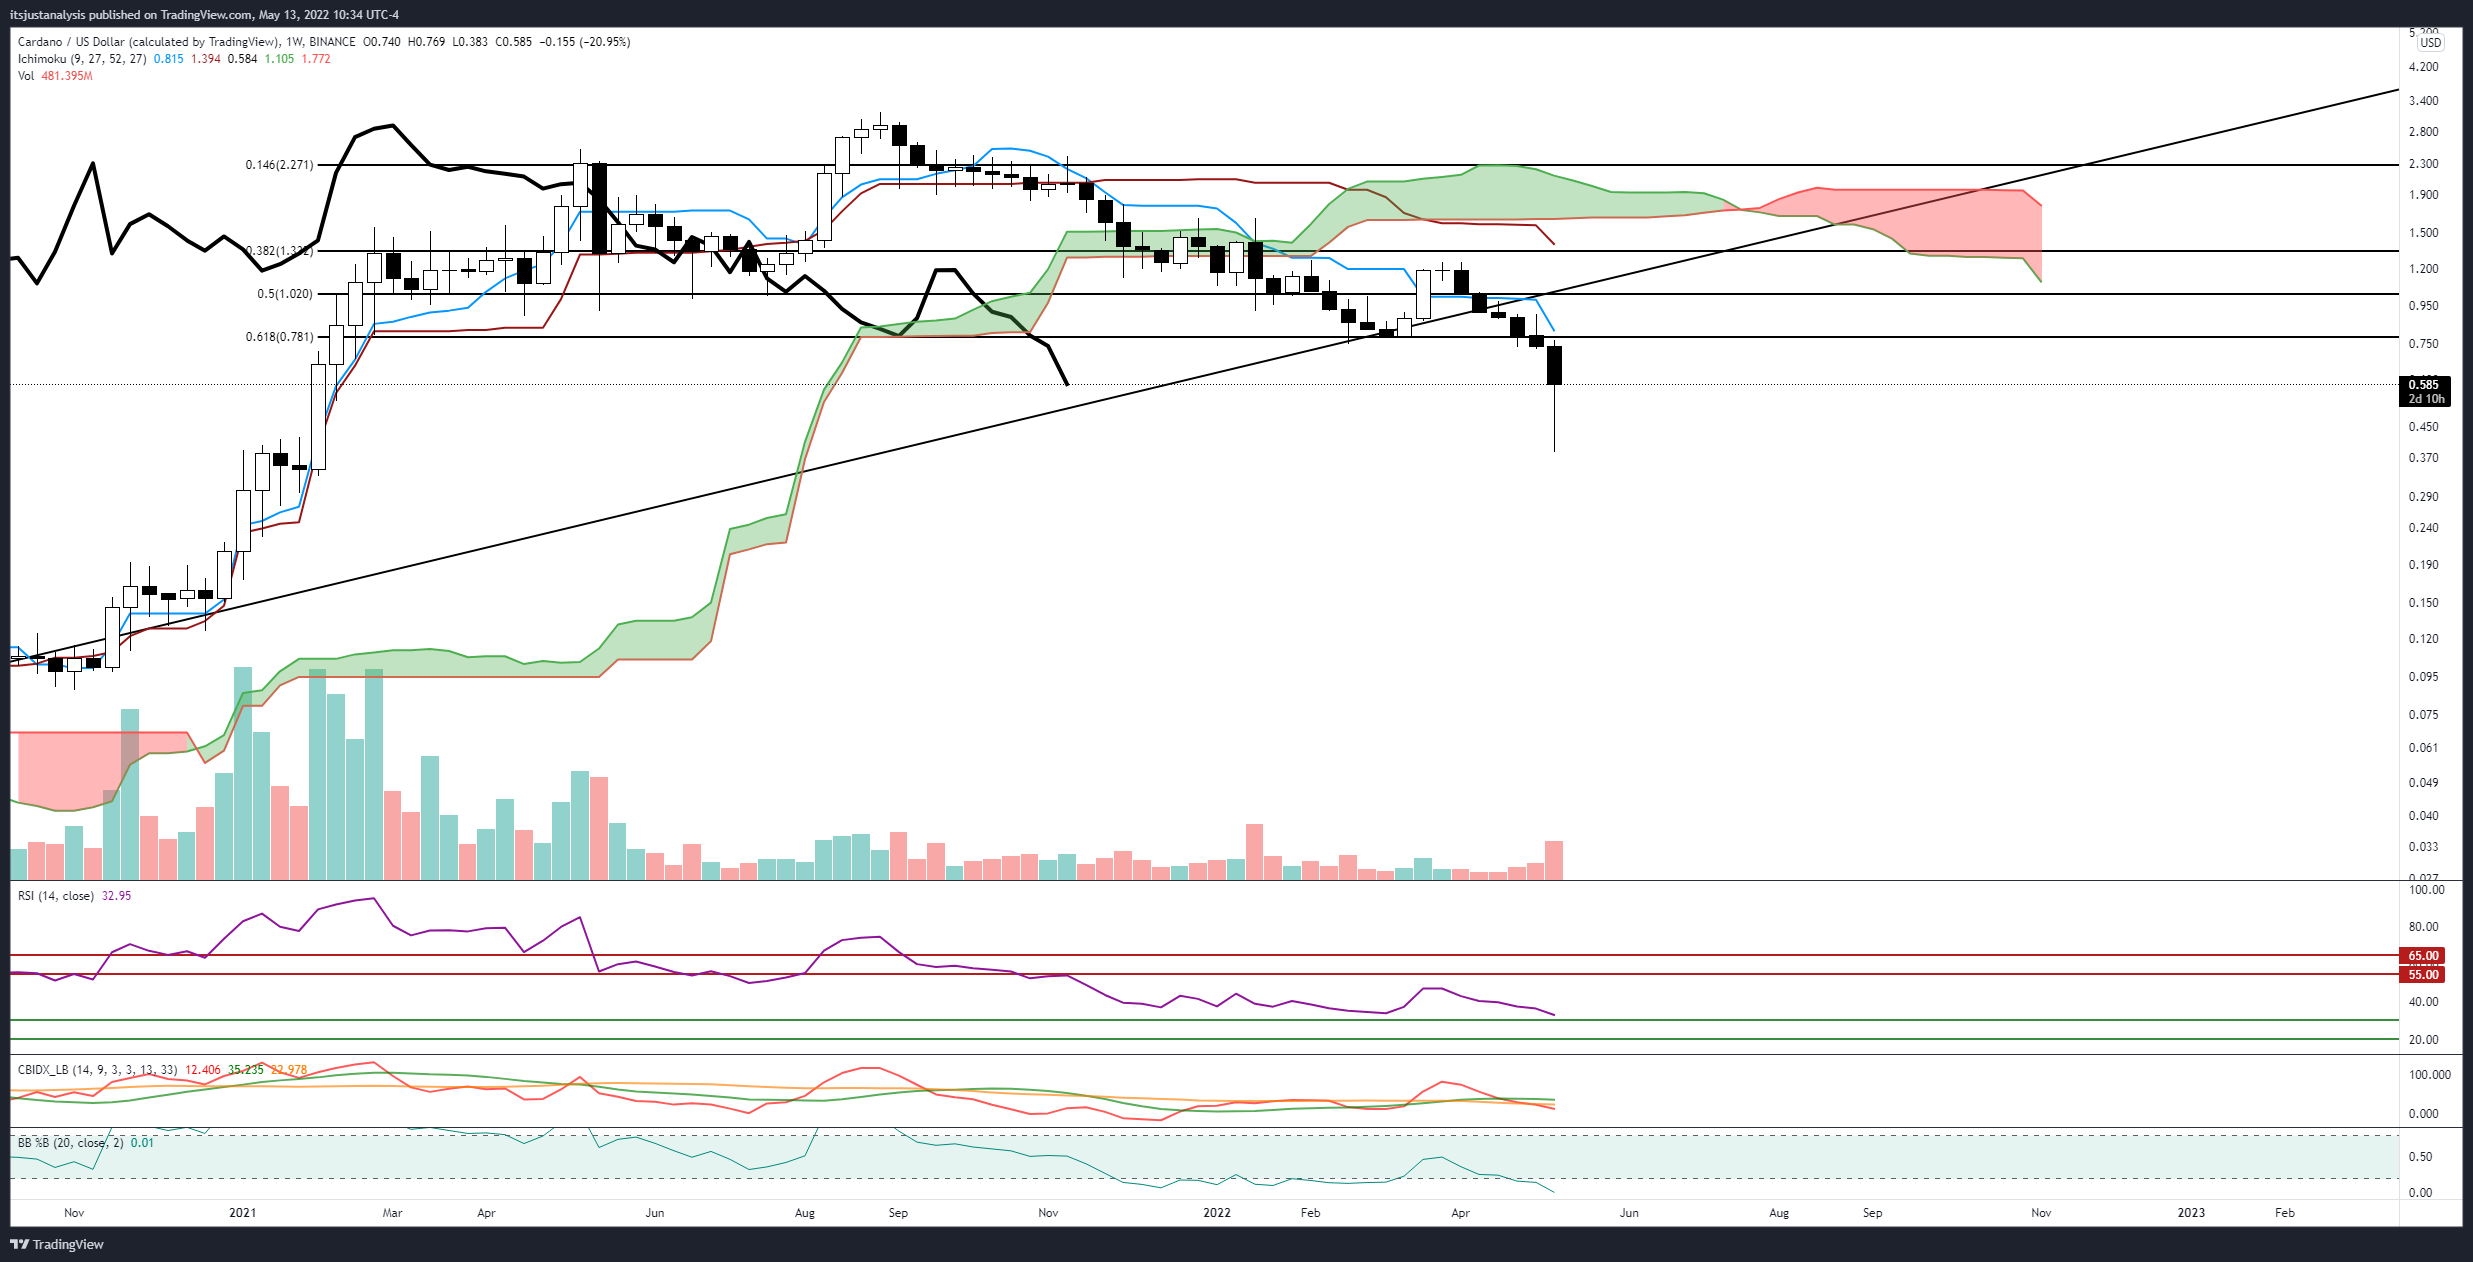
Cardano (ADA) Weekly Ichimoku Kinko Hyo Chart
 Above: Cardano (ADAUSD)
 While the 3-week chart shows a clear and continued uptrend, Cardano’s weekly chart shows the opposite. ADA recently completed an Ideal Bearish Ichimoku Breakout during the week of January 24th, 2022. However, sellers didn’t show much conviction to break ADA lower. Not until the Chikou Span broke down below the Ichimoku Cloud during the week of April 24th, 2022.
Similar to the 3-week chart, the weekly candlestick has developed a clear bullish reversal candlestick in the form of a bullish hammer. Additionally, the weekly volume has been increasing for the past five consecutive weeks, indicating that higher prices are just around the corner.
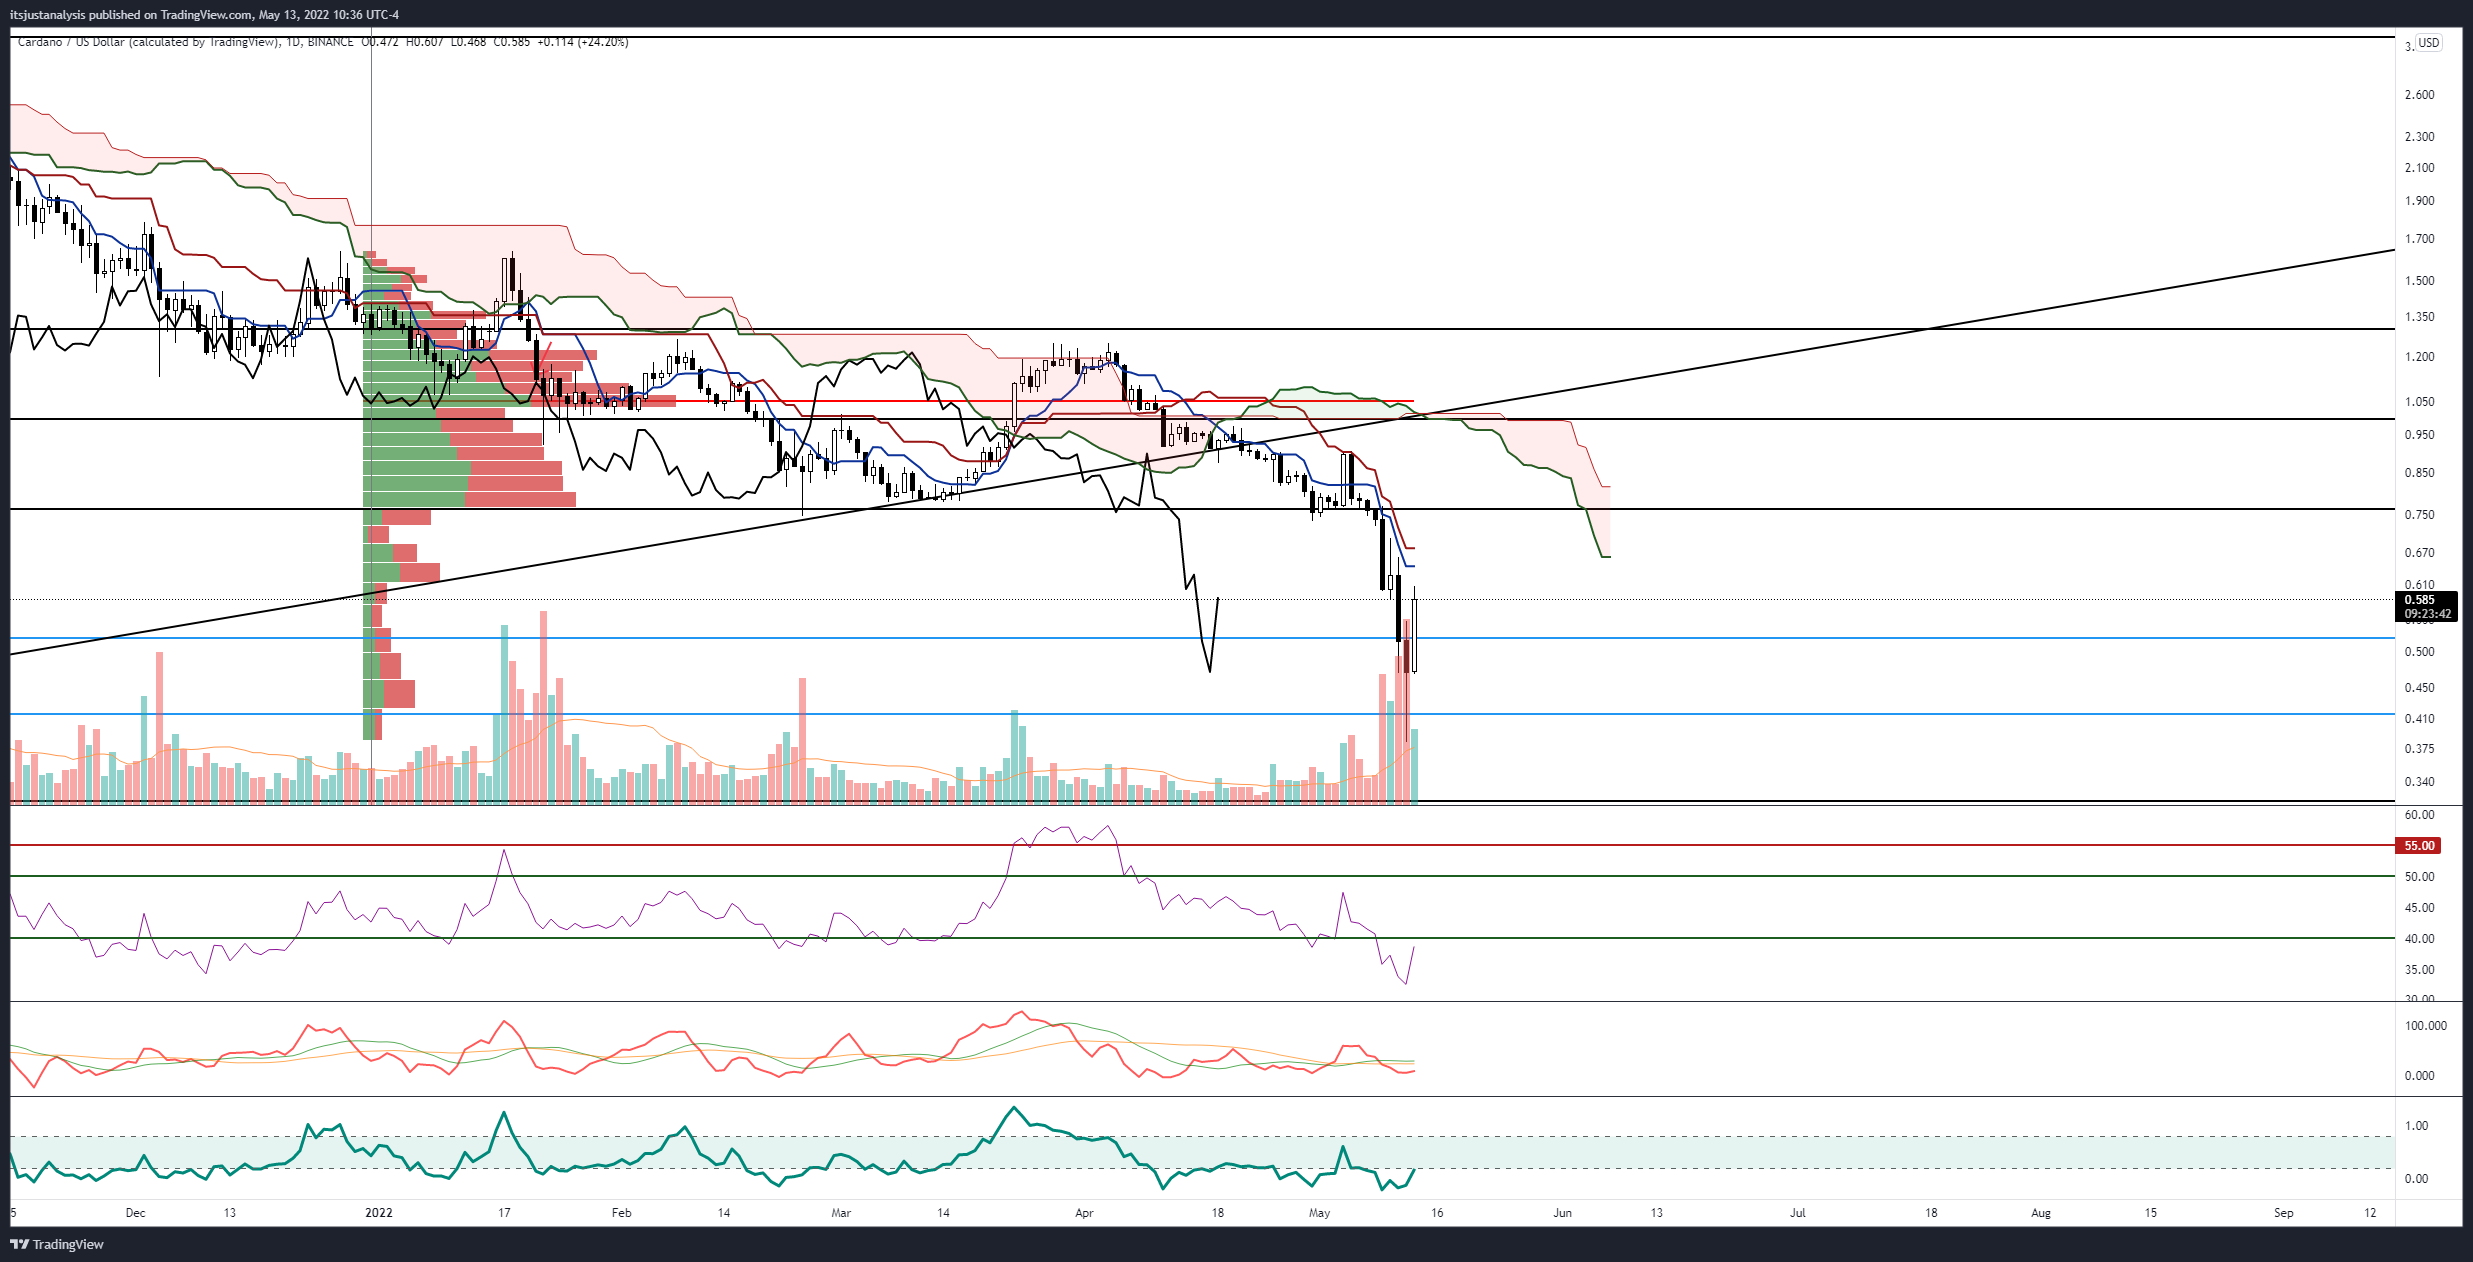
Cardano (ADA) Daily Ichimoku Kinko Hyo Chart
 Above: Cardano (ADAUSD)
The daily chart for Cardano shows a clear rejection of any further bearish price action – but only if the daily close is above the Tenkan-Sen and Kijun-Sen at or above $0.71.
A major contributing factor for the bounce today on Cardano is the Kumo Twist. What we observe on the daily chart with the Kumo Twist is the expected behavior we should observe on the 3-week chart.
The projected retracement now for Cardano is back to the $1.05 value area. So expect to see some initial selling there before ADA continues higher.
Advertisement
Save money on your currency transfers with TorFX, voted International Money Transfer Provider of the Year 2016 – 2020. Their goal is to connect clients with ultra competitive exchange rates and a uniquely dedicated service whether they choose to trade online or over the telephone.
Find out more here.


