


Bitcoin remained strong above the $28,500 support against the US Dollar. BTC is rising, but it must clear $28,500 to move into a positive zone.
- Bitcoin started a fresh increase after it tested the $28,500 support zone.
- The price is now trading above the $29,500 level and the 100 hourly simple moving average.
- There was break above a major bearish trend line with resistance near $29,800 on the hourly chart of the BTC/USD pair (data feed from Kraken).
- The pair could continue to move higher towards the key $30,600 resistance zone.
Bitcoin Price Forms Triple Bottom
Bitcoin price extended decline below the $29,500 support zone. However, the bulls were active near the main $28,500 support zone.
A fresh base was formed near $28,600 and the price started a fresh increase. There was a clear move above the $29,200 and $29,500 resistance levels. The price surpassed the 50% Fib retracement level of the downward move from the $30,630 swing high to $28,635 low.
Besides, there was break above a major bearish trend line with resistance near $29,800 on the hourly chart of the BTC/USD pair. Bitcoin price is now trading above the $29,500 level and the 100 hourly simple moving average.
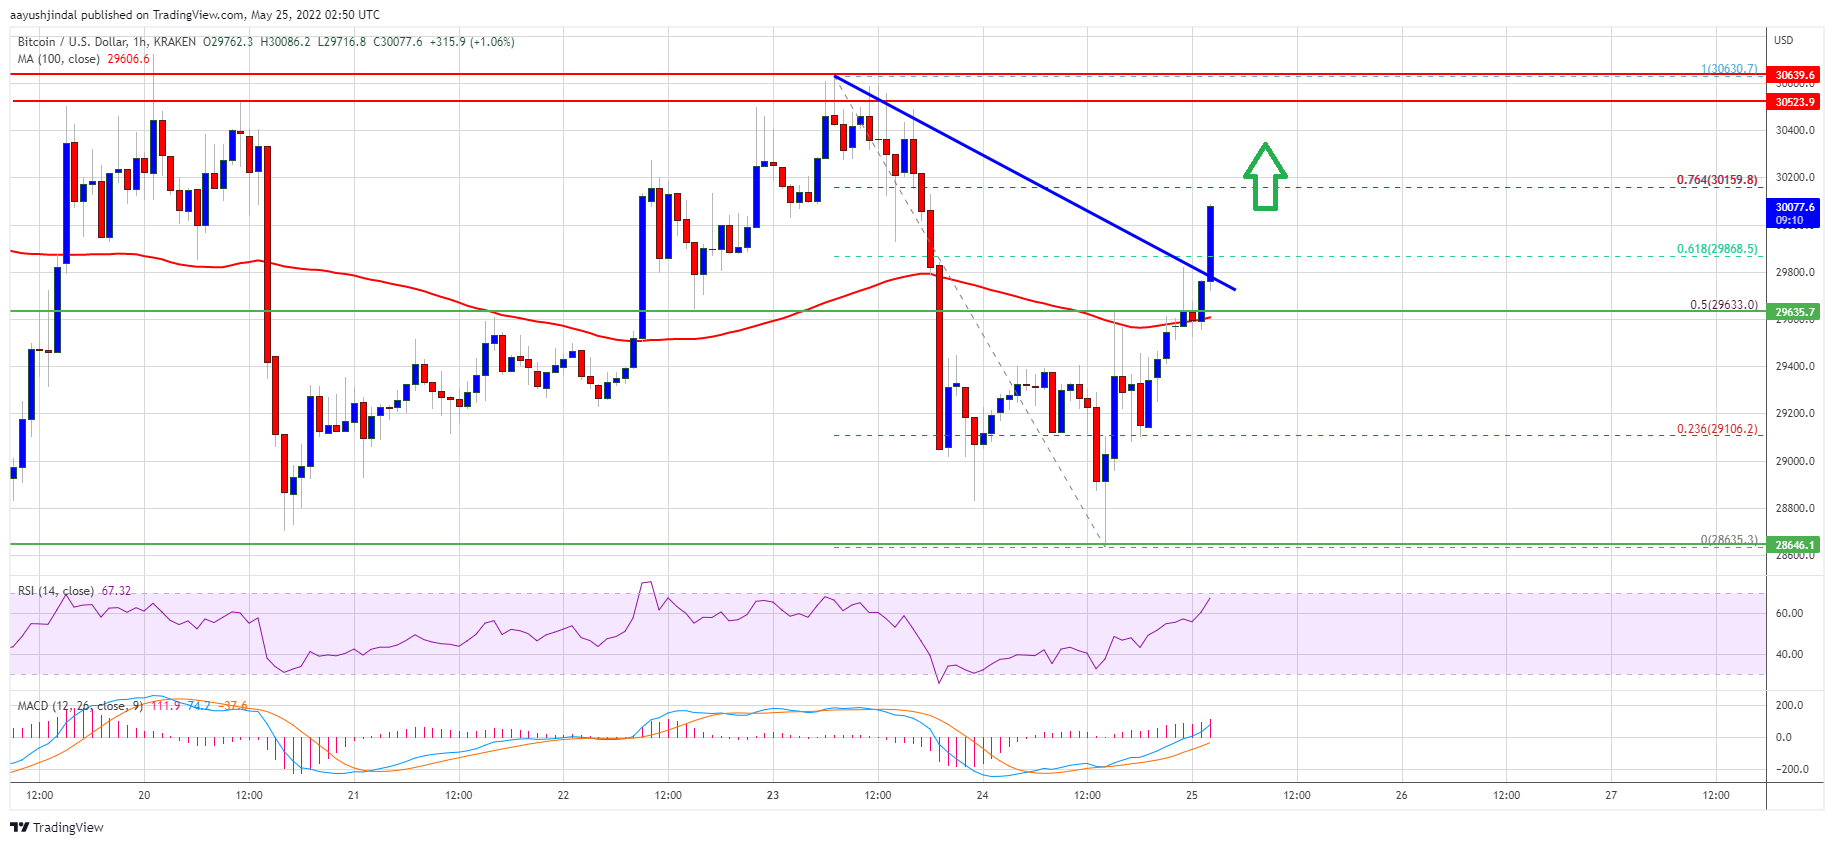
Source: BTCUSD on TradingView.com
An immediate resistance on the upside is near the $30,160 level. It is near the 76.4% Fib retracement level of the downward move from the $30,630 swing high to $28,635 low. The next major resistance is near the $30,600 level. A clear move above the $30,600 resistance level might start a steady increase. In the stated case, the price may perhaps clear the $31,200 resistance zone.
Fresh Decline in BTC?
If bitcoin fails to clear the $30,600 resistance zone, it could start another decline. An immediate support on the downside is near the $29,600 level.
The first major support is near the $29,500 level and the 100 hourly simple moving average. A downside break below the $29,500 support might send the price further lower. The main support is still near the $28,500 level, where the bulls are likely to take a strong stand.
Technical indicators:
Hourly MACD – The MACD is now gaining pace in the bullish zone.
Hourly RSI (Relative Strength Index) – The RSI for BTC/USD is now well above the 50 level.
Major Support Levels – $29,500, followed by $28,500.
Major Resistance Levels – $30,150, $30,500 and $30,600.

 Needs $0.10 Break Or Faces Fresh Downside Move")


