


Bitcoin has been consolidating between the realized price and the balanced price for three months so far, here’s why this can suggest the bear market may still have some ways to go before it concludes.
Bitcoin Is Currently Below, But Near, The $21.1k Realized Price
According to the latest weekly report from Glassnode, the realized and the balanced price models are suitable for approximating the bottom formation range for BTC.
The “realized price” is a Bitcoin value model based on the idea of realized cap. In simple terms, what it represents is the cost-basis of the average holder in the market.
This means that whenever the true BTC price is trading below this metric, the market as a whole enters into a state of loss.
Another model for Bitcoin is the “balanced price,” which is calculated by taking the difference between the realized price and the transferred price.
The former of the two is, as explained before, the mean cost-basis, or the price the average investor “paid” for their coins. The latter model, the new “transferred price,” signifies just the opposite.
It’s based on the price that investors have been selling their coins at, and thus represents the price at which they “spent” their BTC.
Because of this fact, the report explains that the balanced price “can be thought of as a form of a “Fair Value” model, capturing the difference between what was paid (cost-basis) and what was spent (transferred).”
Now, here is a chart that shows the trend in these Bitcoin price models, as well as the true price, since the year 2014:
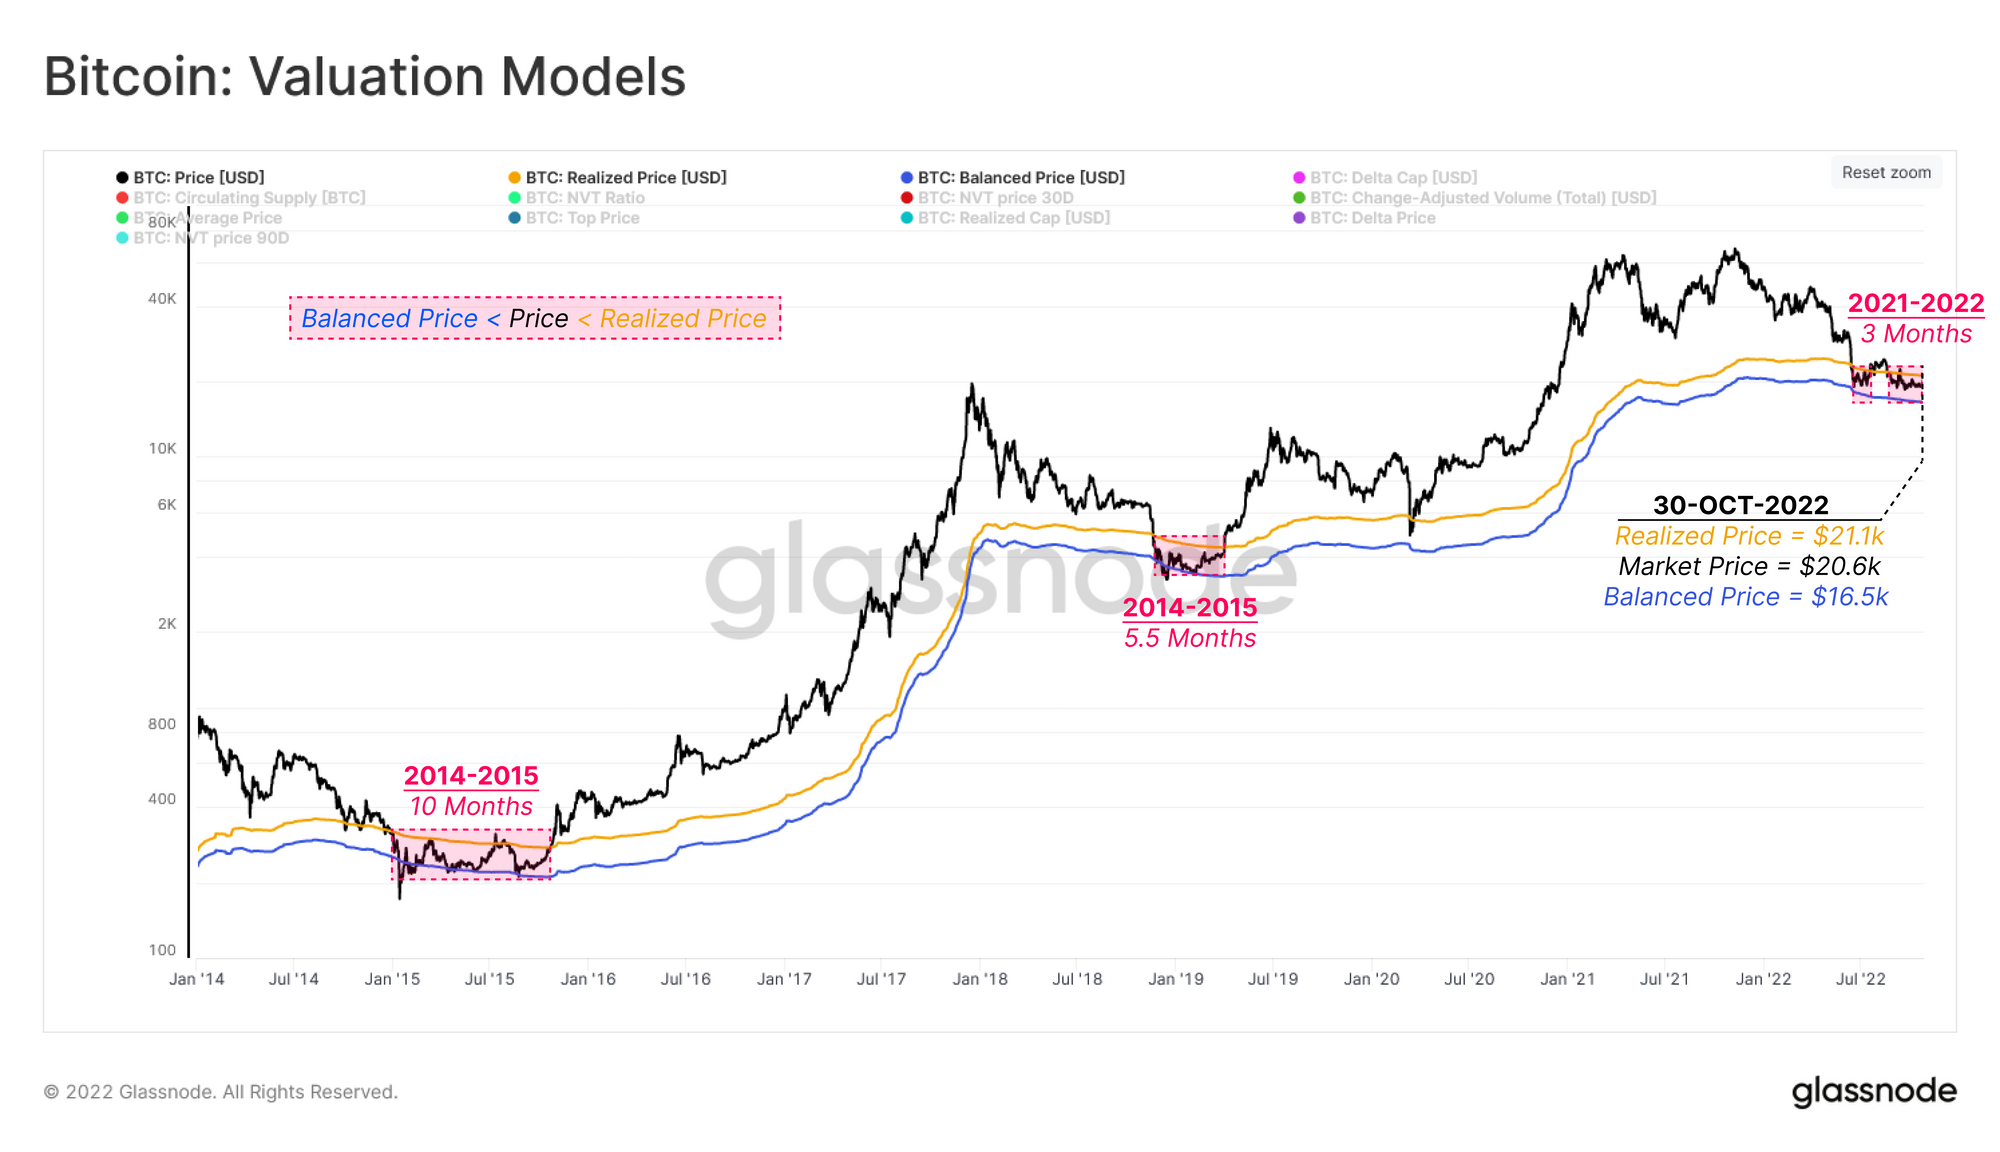
The time spent by the crypto in this range during the various cycles | Source: Glassnode's The Week Onchain - Week 44, 2022
As you can see in the above graph, the current Bitcoin realized price is around $21.1k, while the balanced price is about $16.5k.
Historically, the crypto has consolidated between these two levels while the bear market bottom formation period has lasted.
In the 2014-15 cycle, BTC was trapped in this region for 10 months, while in 2018-19 it was stuck there for 5.5 months.
So far in the current bear, Bitcoin has spent a total of around three months in this region. Glassnode notes that the present cycle is thus still missing the duration observed in the previous ones.
Right now, the crypto is nearing a retest of the upper bound of this range, but if this bear is also at least as long as the historical ones, then the crypto might be rejected back down.
BTC Price
At the time of writing, Bitcoin’s price floats around $20.5k, up 7% in the last week.

BTC holds strong above $20k | Source: BTCUSD on TradingView
Featured image from Daniel Krueger on Unsplash.com, charts from TradingView.com, Glassnode.com


