


On-chain data shows signs of some fresh Bitcoin accumulation taking place during the last month.
Bitcoin UTXOs Aged 1 Week To 1 Month Have Risen Up In Recent Days
As pointed out by an analyst in a CryptoQuant post, UTXOs purchased between 1 week and 1 month ago have risen since the FTX crash.
The relevant indicator here is the “Realized Cap – UTXO Age Bands,” which tells us which age group has what percentage of the Bitcoin realized cap.
The “realized cap” here refers to a type of BTC capitalization model in which the crypto’s cap is calculated by weighing each coin in the circulating supply against the price at which it was last moved, and then taking the sum for the entire supply.
This capitalization method is different from the usual market cap, where all the coins are simply multiplied with the current BTC price.
The “age bands” are groups that define the time period under which the UTXOs falling into it were last moved. For example, the “1m-3m” age band includes all UTXOs that haven’t shown any movement since between 1 and 3 months ago.
Now, the age band of relevance in the current discussion is the “1w-1m” group. Here is a chart that shows how the realized cap contribution of this Bitcoin band has changed during the past couple of years:
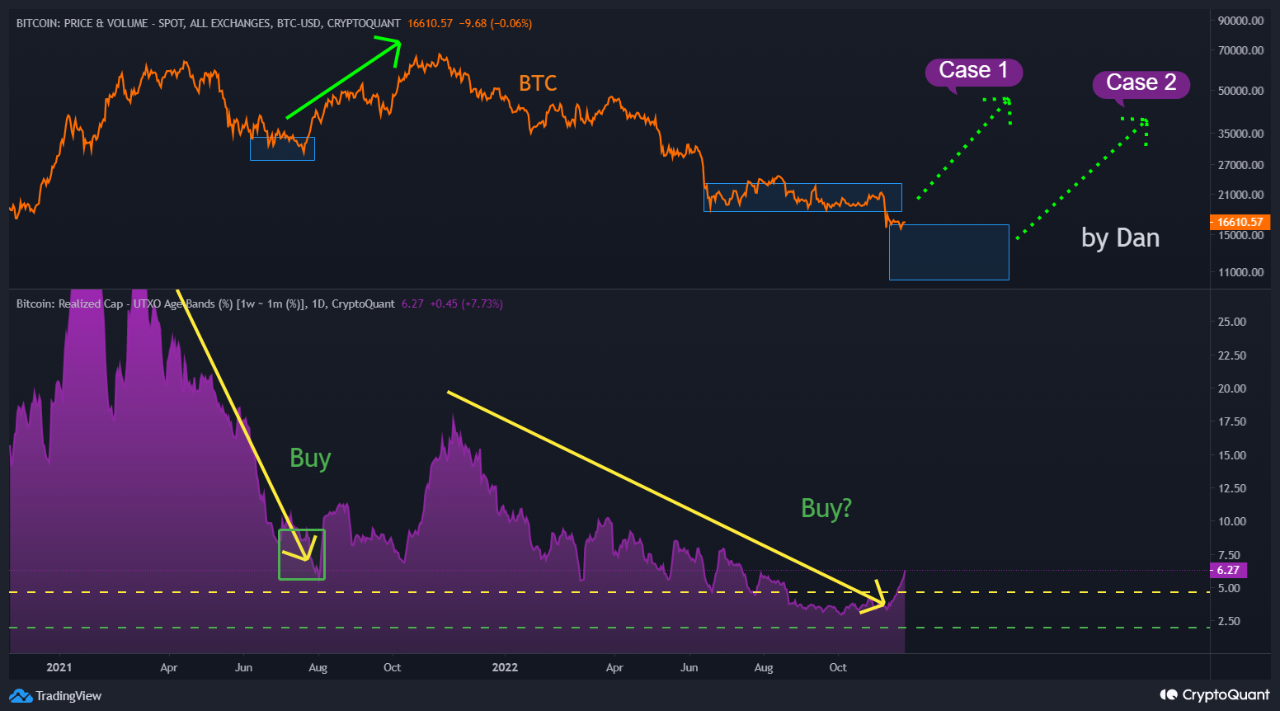
Looks like the value of the metric has been trending up recently | Source: CryptoQuant
As you can see in the above graph, the realized cap of the Bitcoin UTXOs falling into the 1w-1m band was in a decline during the bear market and had reached very low values by the time the FTX collapse rolled around.
Since the crash, however, the age band has been observing a rapid uptrend. This means that there have been a large number of coins purchased between 1 week and 1 month ago.
Based on this trend, it seems like some investors have been busy accumulating at the lows that have been seen after the crash, despite the wider market feeling uncertainty due to the FTX contagion possibly causing a cascade of bankruptcies of other platforms.
BTC Price
At the time of writing, Bitcoin’s price floats around $16.5k, down 1% in the last week. Over the past month, the crypto has lost 15% in value.
Below is a chart that shows the trend in the price of the coin over the last five days.

The value of the crypto seems to have returned to a flat curve during the last few days | Source: BTCUSD on TradingView
Featured image from Kanchanara on Unsplash.com, charts from TradingView.com, CryptoQuant.com


