


The Dogecoin (DOGE) price saved a plunge by creating a bullish candlestick on Jan. 31. The upward movement could continue toward $0.115.
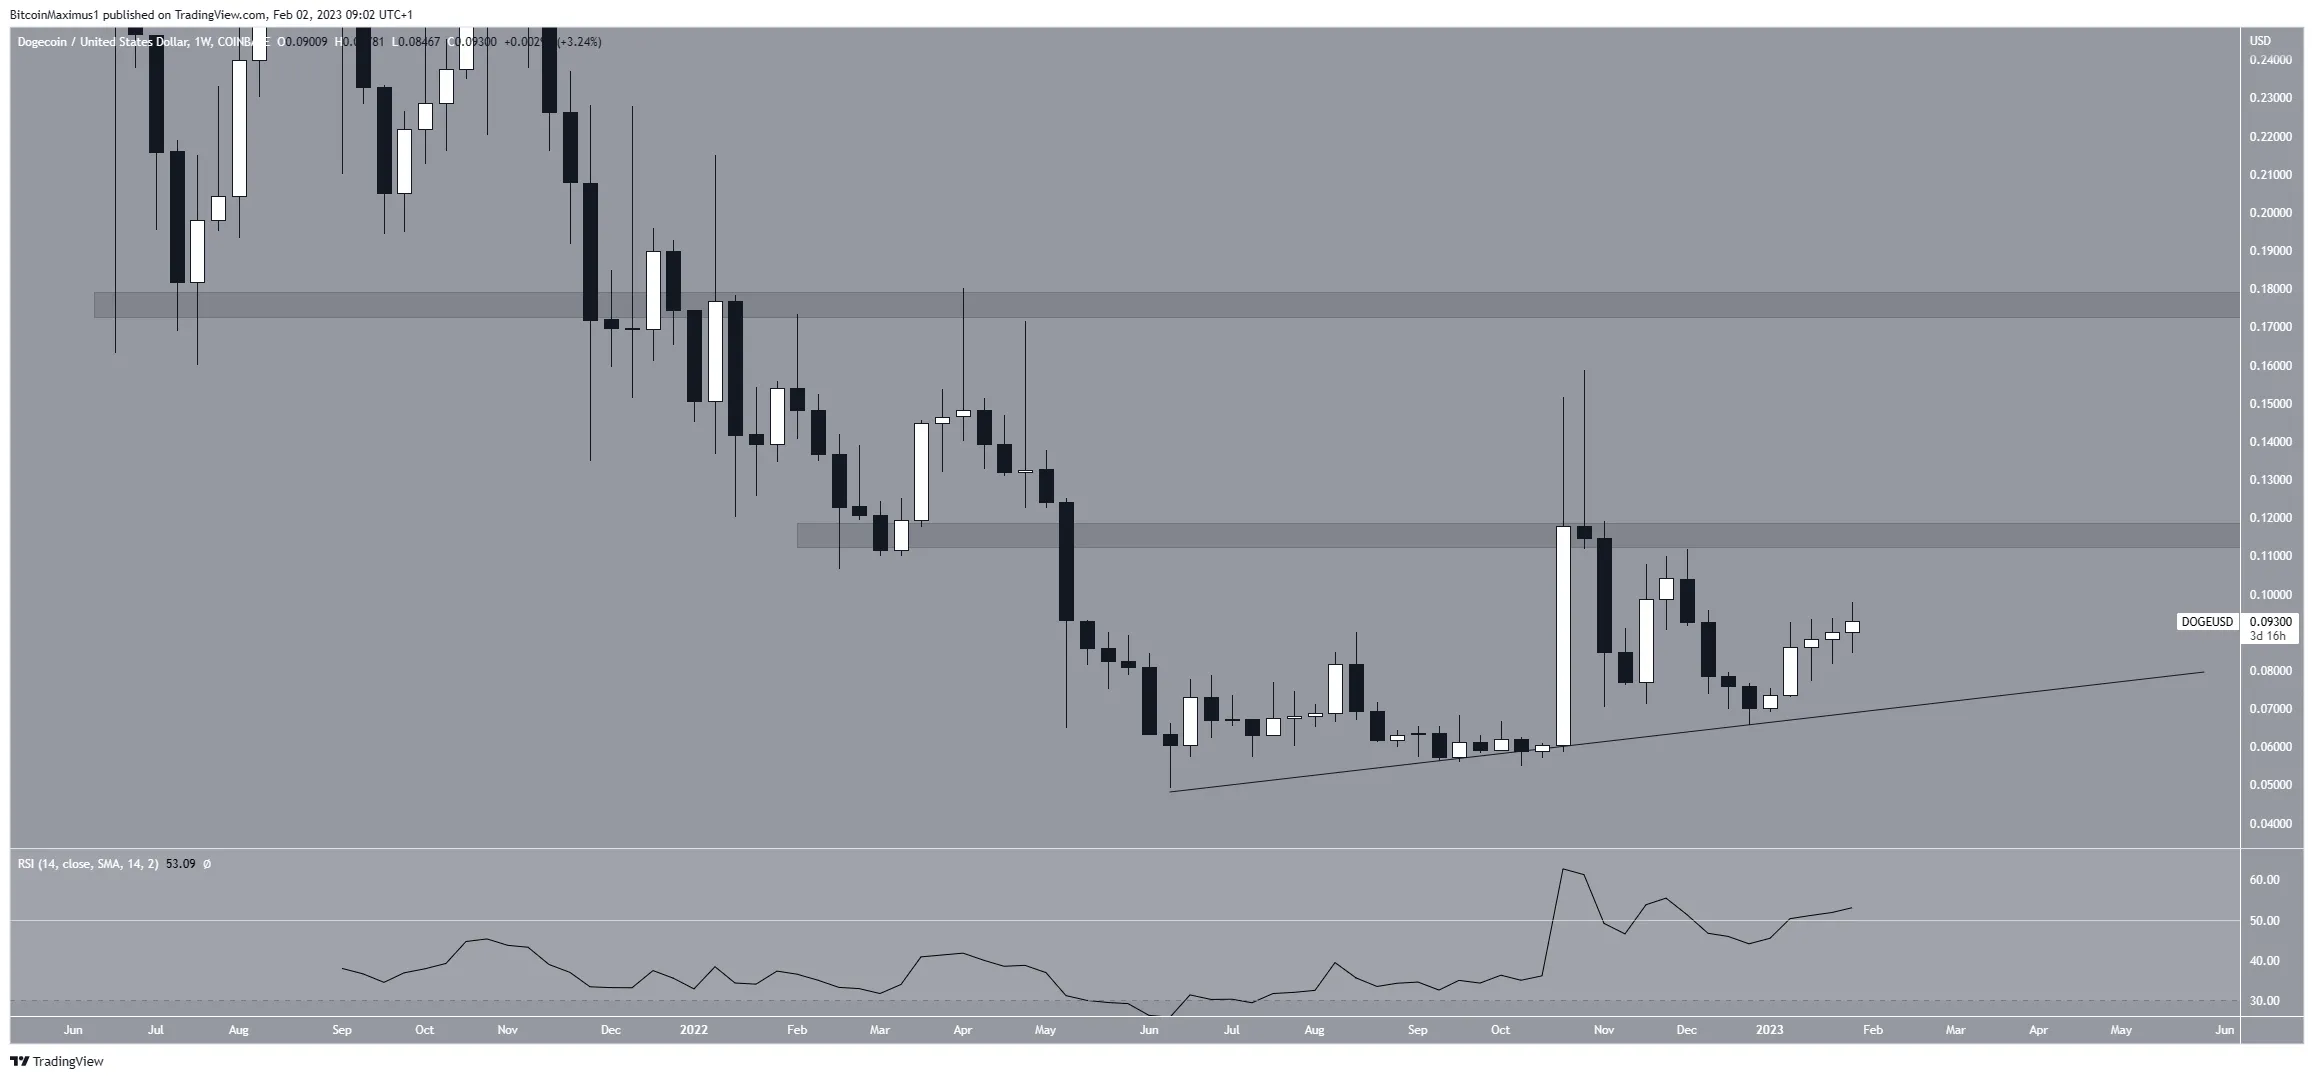
The technical analysis from the weekly time frame shows that the Dogecoin price is trading below its main resistance at $0.115. The area had previously provided support, but the DOGE price broke down from it in May 2022.
Then, the area turned to resistance in Oct. If the DOGE price were to break out, the next resistance would be at an average price of $0.175.
While the weekly RSI is increasing, it is barely above 50 and has not generated any bullish divergence yet. Therefore, more is needed to predict that the upward movement will continue.
On the other hand, if the digital currency price were to break down from its long-term ascending support line at $0.080, it could begin a downward movement to $0.050.
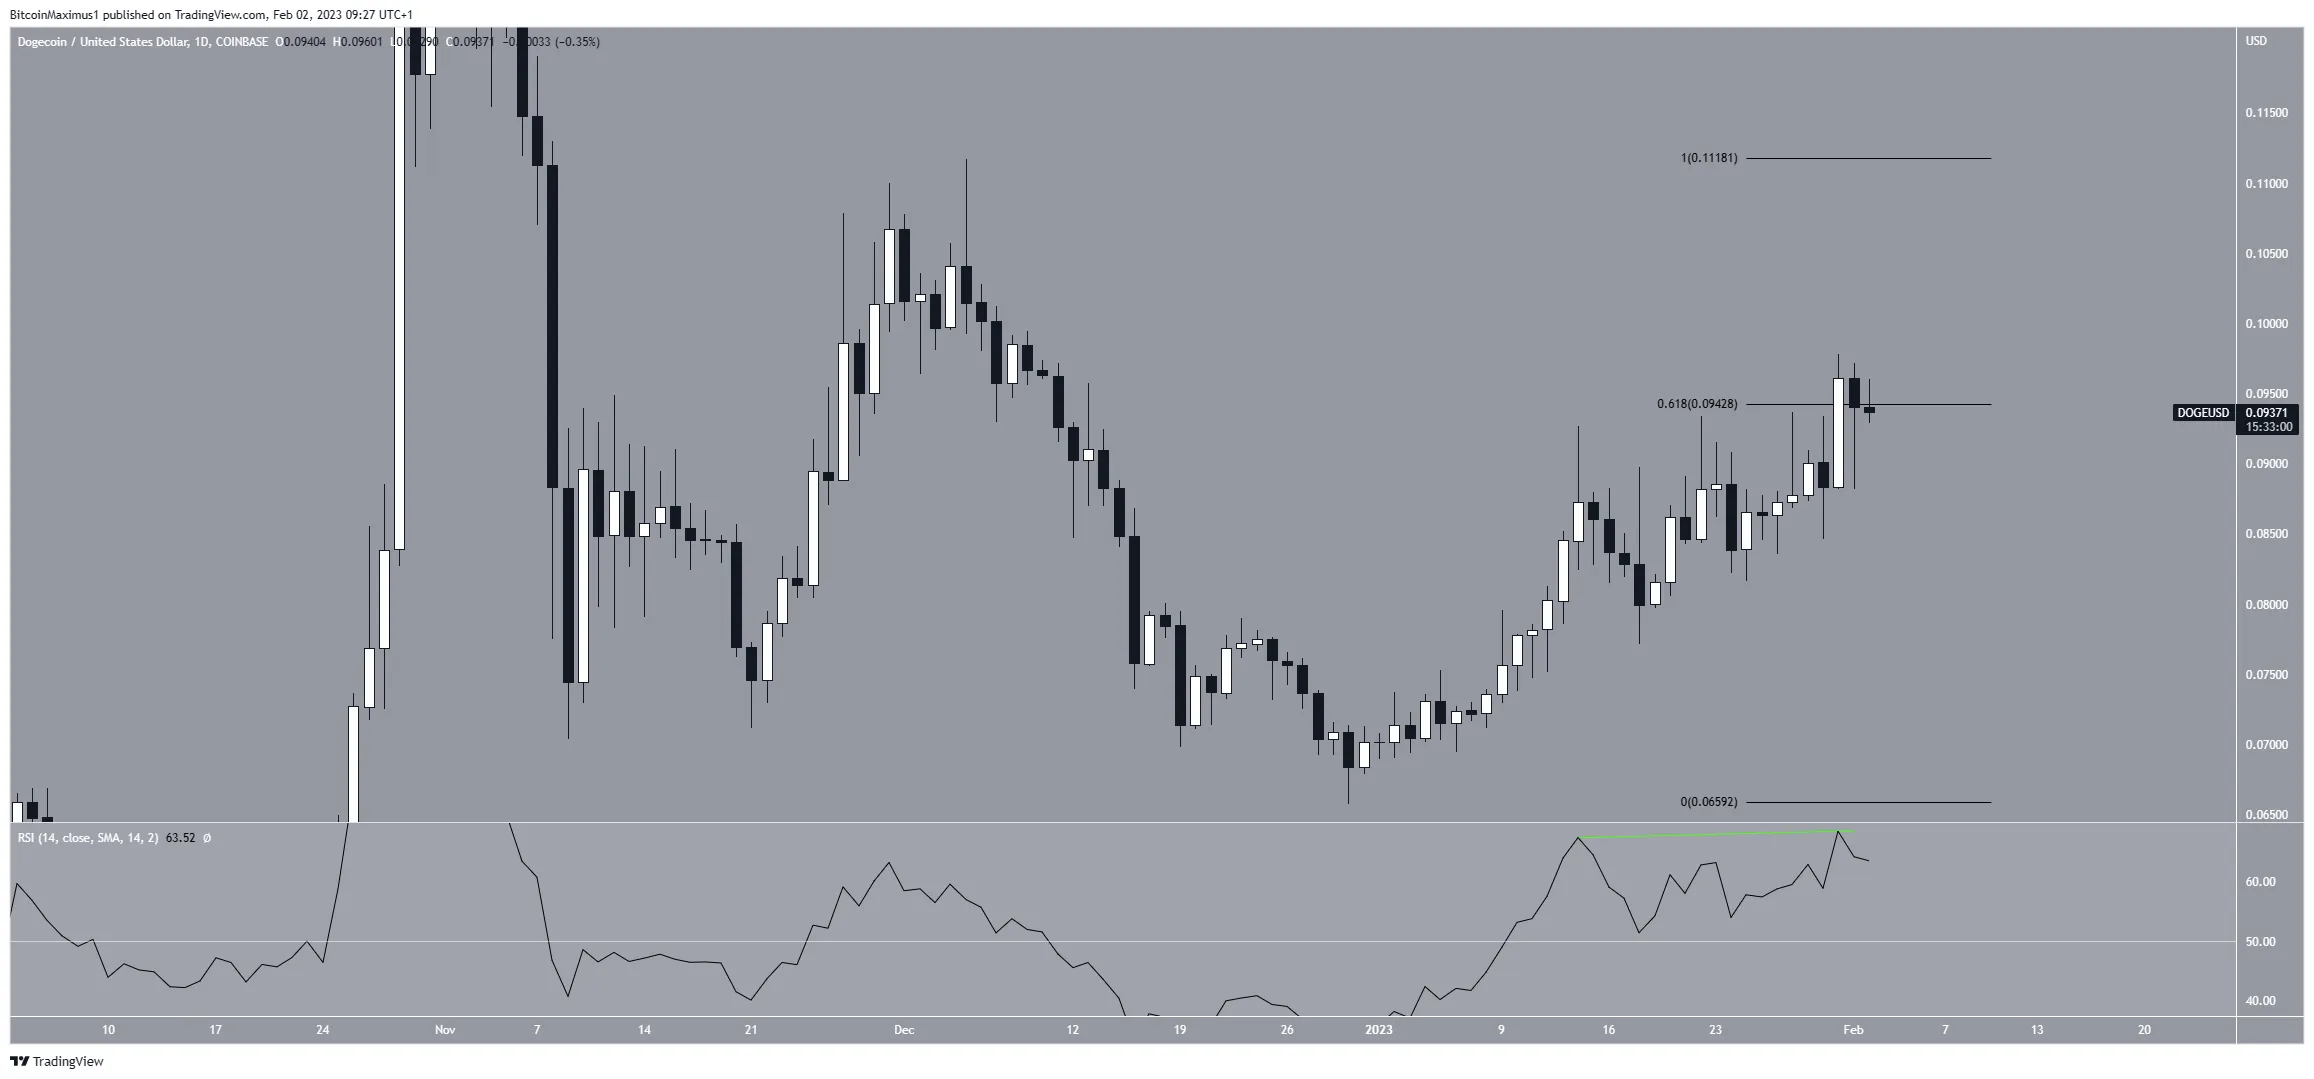
Dogecoin Price Reclaims Crucial Resistance
The daily chart provides a more decisively positive outlook for the meme coin, mostly due to the bullish candlestick on Jan. 31, which caused a breakout from the 0.618 Fib retracement resistance level.
The increase above the 0.618 Fib retracement resistance level was important not only because of the price action but because it invalidated a bearish divergence that had been developing in the daily RSI.
Therefore, the increase is expected to continue toward $0.115.
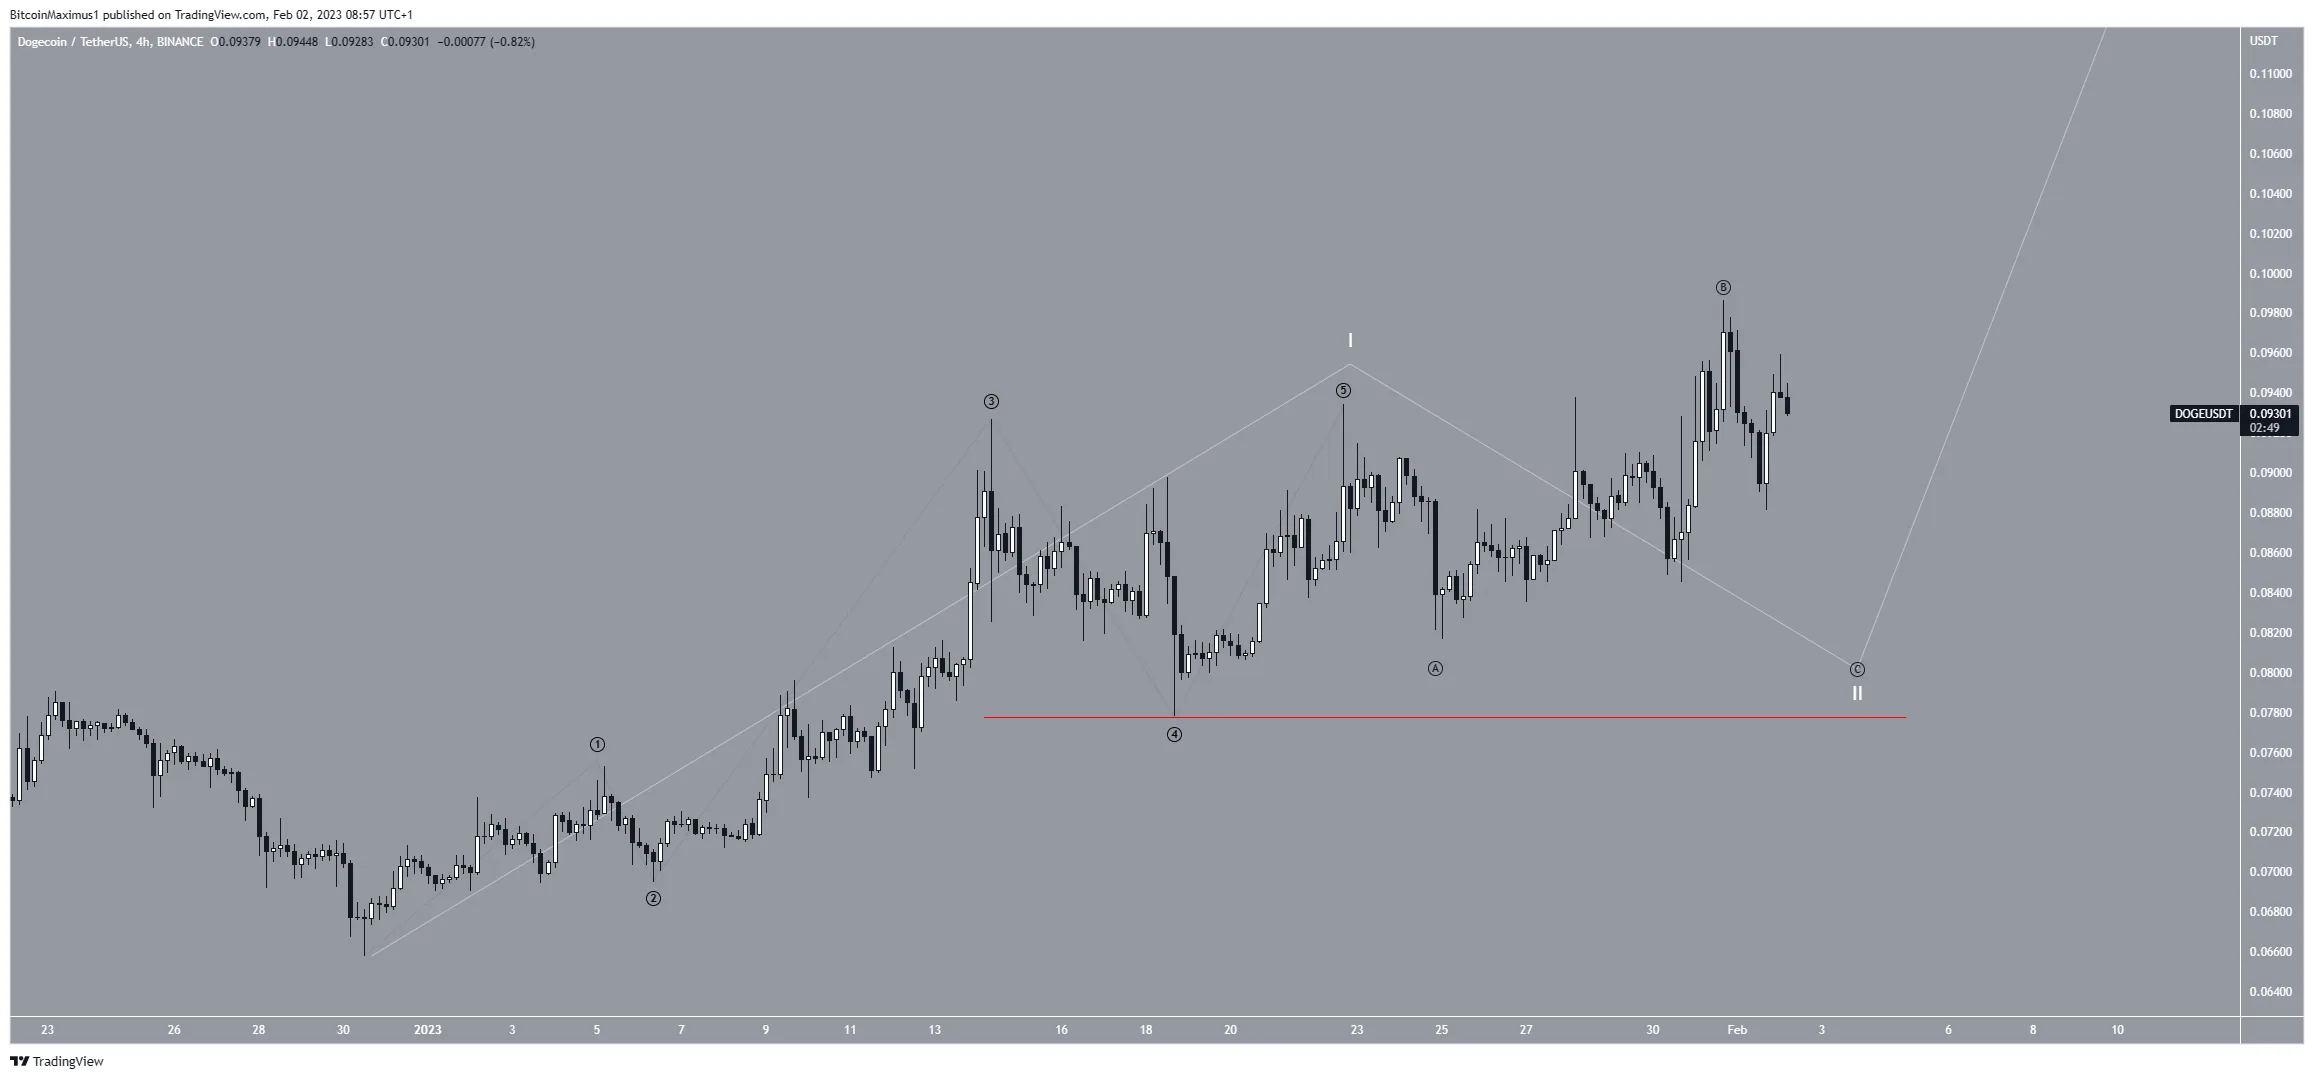
Wave Count Supports Increase
Finally, the wave count supports the continuation of the upward movement, even though a short-term drop could initially occur.
It seems that the DOGE price is in wave two of a five-wave upward movement (white), which could complete over the next 24 hours. The sub-wave count is given in black.
Due to the considerable overlap in the upward movement from Jan. 25 to now, which led to the highest price of $0.097, it is likely that the move is part of the B sub-wave.
So, the upward movement is expected to continue after a short-term drop that completes the C sub-wave. Since what would follow is wave three, the upward movement could accelerate further toward at least $0.115 and possibly $0.175.
On the other hand, a decisive close below the sub-wave four lowest price (red line) at $0.077 would invalidate this count since it would also cause a breakdown from the long-term ascending support line. Then, the Dogecoin price could fall below $0.050.
To conclude, the most likely Dogecoin price forecast suggests that the DOGE price will at least reach the $0.115 resistance area. However, a close below $0.077 would invalidate this bullish price analysis and could send DOGE toward $0.050.
For BeInCrypto’s latest crypto market analysis, click here.
Disclaimer
BeInCrypto strives to provide accurate and up-to-date information, but it will not be responsible for any missing facts or inaccurate information. You comply and understand that you should use any of this information at your own risk. Cryptocurrencies are highly volatile financial assets, so research and make your own financial decisions.
 Struggles to Wake Up While Floki Rockets Higher – TradingView")


