


Ethereum price is recovering above $1,700 against the US Dollar. ETH could continue to move up if it clears the $1,780 resistance zone.
- Ethereum was able to climb above the $1,700 and $1,720 resistance levels.
- The price is trading above $1,700 and the 100-hourly Simple Moving Average.
- There was a break above a major bearish trend line with resistance near $1,720 on the hourly chart of ETH/USD (data feed via Kraken).
- The pair could rise further above the $1,750 and $1,780 resistance levels.
Ethereum Price Attempts Recovery
Ethereum’s price was able to form a support base above the $1,620 level. ETH started a decent recovery wave above the $1,680 and $1,700 resistance levels, similar to Bitcoin.
Besides, there was a break above a major bearish trend line with resistance near $1,720 on the hourly chart of ETH/USD. The bulls even pushed the price above the $1,750 resistance and the 100-hourly Simple Moving Average. It tested the $1,770 level. A high is formed near $1,768 and the price is now correcting gains.
There was a move below the $1,750 level. Ether dipped below the 23.6% Fib retracement level of the upward move from the $1,620 swing low to the $1,768 high.
It is now trading above $1,700 and the 100-hourly Simple Moving Average. Immediate resistance is near the $1,740 level. The next major resistance is near the $1,770 level.
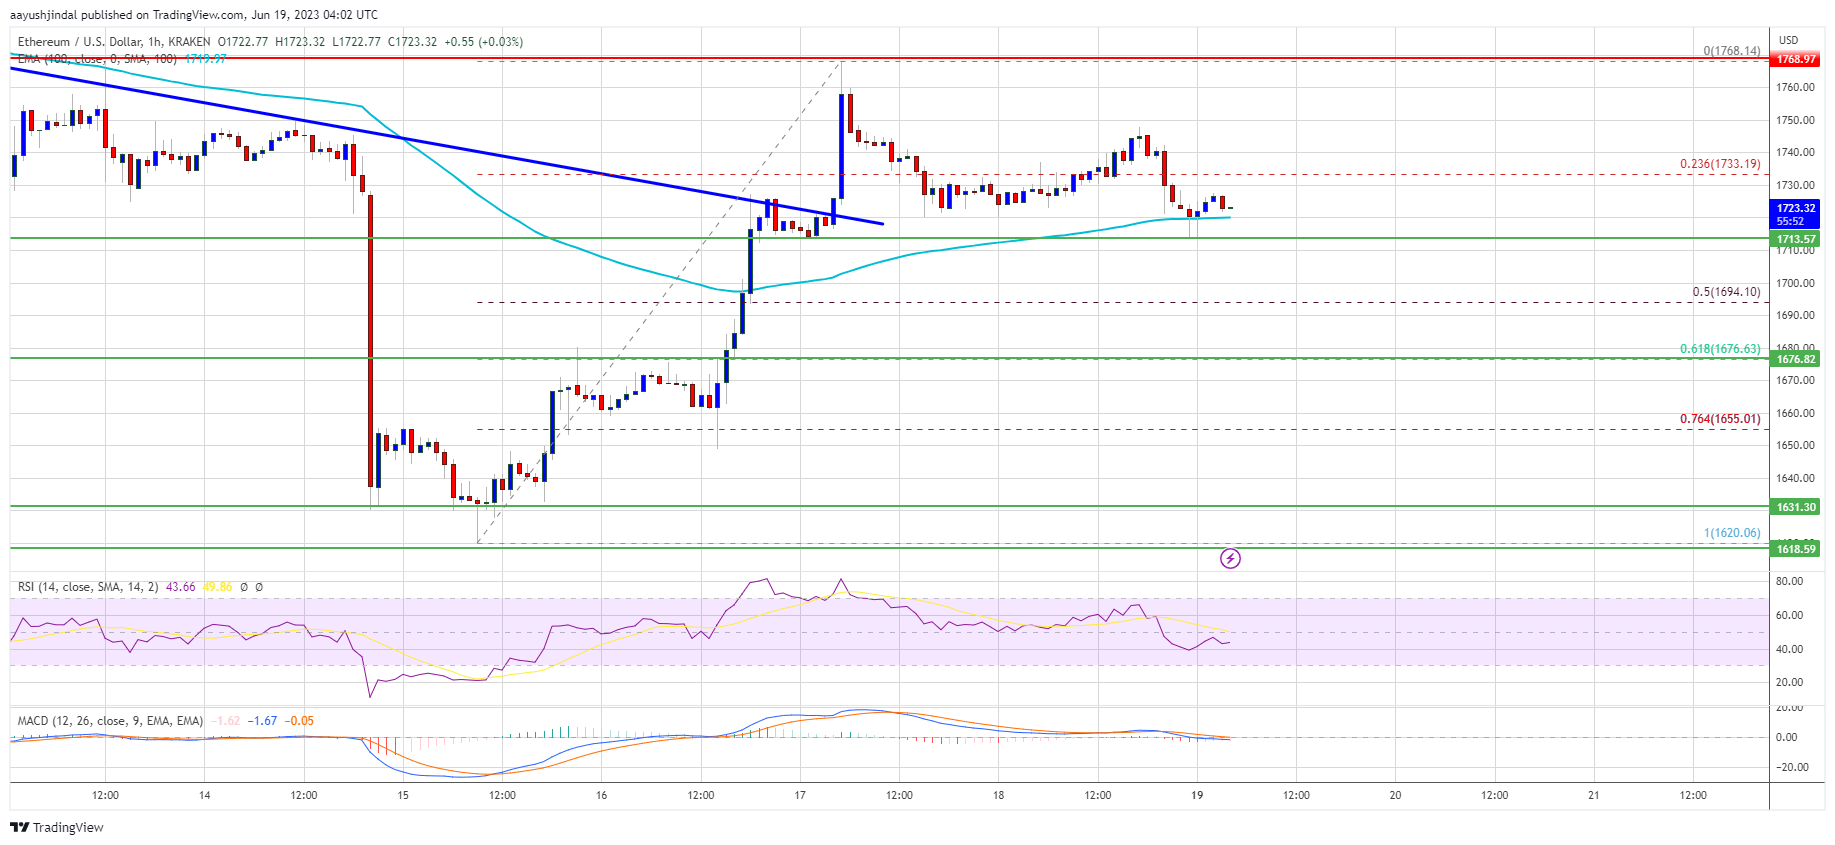
Source: ETHUSD on TradingView.com
The main resistance is near $1,780. A proper move above the $1,770 and $1,780 resistance levels might start a steady recovery wave. The next resistance sits near $1,820, above which Ethereum could rise toward the $1,850 level. Any more gains above the $1,850 resistance zone might send the price toward the $1,920 resistance.
Fresh Decline in ETH?
If Ethereum fails to clear the $1,780 resistance, it could start another decline. Initial support on the downside is near the $1,710 level.
The next major support is near the $1,675 level or the 61.8% Fib retracement level of the upward move from the $1,620 swing low to the $1,768 high. If there is a break and close below the $1,675 support, the price could dive toward the $1,620 support. Any more losses may perhaps send the price toward the $1,550 zone.
Technical Indicators
Hourly MACD – The MACD for ETH/USD is losing momentum in the bullish zone.
Hourly RSI – The RSI for ETH/USD is now below the 50 level.
Major Support Level – $1,675
Major Resistance Level – $1,780


