


Bitcoin price is struggling to recover above the $26,500 level. BTC could gain bearish momentum if there is a move below the $25,600 support.
- Bitcoin is struggling to recover above the $26,500 resistance zone.
- The price is trading below $26,400 and the 100 hourly Simple moving average.
- There was a break below a connecting bullish trend line with support near $26,000 on the hourly chart of the BTC/USD pair (data feed from Kraken).
- The pair could continue to move down if there is a break below the $25,600 support.
Bitcoin Price Aims Lower
Bitcoin price attempted a recovery wave above the $26,000 resistance zone. BTC climbed above $26,200 but struggled to continue higher.
It formed a top near the $26,500 zone and recently started a fresh decline. There was a move below the $26,200 level. Besides, there was a break below a connecting bullish trend line with support near $26,000 on the hourly chart of the BTC/USD pair.
Bitcoin tested the 50% Fib retracement level of the recovery wave from the $24,800 swing low to the $26,981 high. It is now trading below $26,400 and the 100 hourly Simple moving average.
Immediate resistance is near the $26,100 level and the 100 hourly Simple moving average. The next major resistance is near $26,250. A clear move above the $26,250 resistance might send the price toward the $26,500 resistance zone.
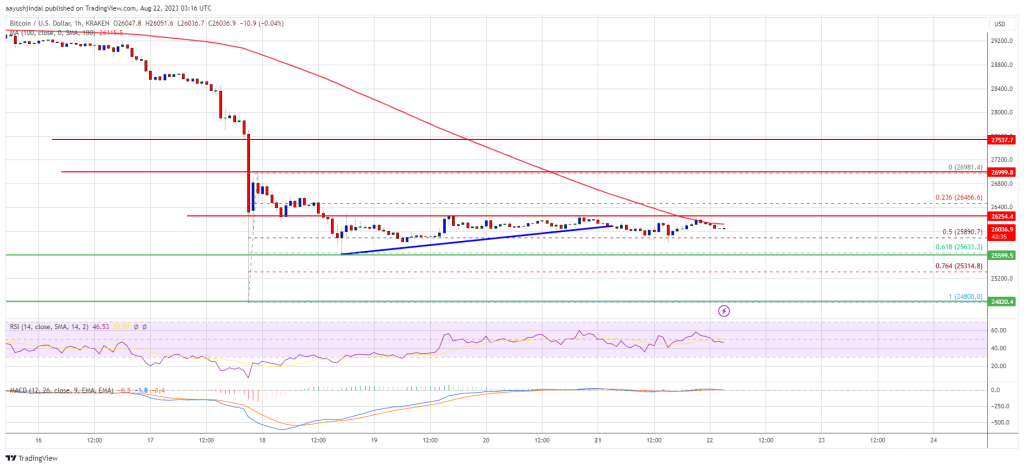
Source: BTCUSD on TradingView.com
The main breakout zone is now forming near the $27,000 zone. A close above the $27,000 resistance could start a decent increase toward the $27,550 resistance zone. Any more gains might set the pace for a larger increase toward $28,150.
Another Decline In BTC?
If Bitcoin fails to clear the $26,250 resistance, it could continue to move down. Immediate support on the downside is near the $25,900 zone.
The next major support is near the $25,600 level or the 61.8% Fib retracement level of the recovery wave from the $24,800 swing low to the $26,981 high. A downside break below the $25,600 level might push the price further into a bearish zone. In the stated case, the price could drop toward $25,000.
Technical indicators:
Hourly MACD – The MACD is now gaining pace in the bearish zone.
Hourly RSI (Relative Strength Index) – The RSI for BTC/USD is now below the 50 level.
Major Support Levels – $25,900, followed by $25,600.
Major Resistance Levels – $26,250, $26,500, and $27,000.


