


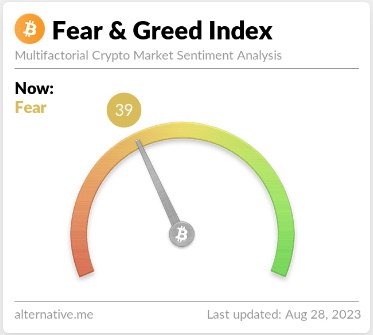
Bitcoin (BTC) is currently marked by cautious sentiments as the Crypto Fear and Greed Index holds steady within the fear zone, scoring 39 out of 100 and showing a slight increase from the previous day.
This sentiment reflects the prevailing uncertainty in the cryptocurrency realm. Amidst this backdrop, Bitcoin’s price trend takes center stage, influenced by the evolving dynamics of the market.
Zooming in on the price action reveals a distinct pattern on the 4-hour timeframe. Bitcoin’s price, guided by a falling channel pattern, traces a consistent downtrend, oscillating between two parallel trendlines.
This price movement hints at the formation of a well-recognized bullish reversal pattern, known as the falling parallel channel.
At its current valuation of $25,877 according to CoinGecko, Bitcoin experienced a minor 0.6% dip in the last 24 hours and a marginal 0.3% decline over the past week.
Despite these fluctuations, the price behavior strikingly emulates the falling parallel channel, suggesting the potential for a shift in momentum.
Deciphering Bitcoin Falling Parallel Channel
The falling parallel channel is a technical pattern often observed during a downtrend. It features two parallel trendlines encompassing the price action within a defined range.
The lower trendline provides a support level, while the upper trendline acts as resistance. This pattern typically indicates a possible trend reversal, with a breakout above the upper trendline indicating an imminent bullish recovery.
For Bitcoin, a significant breakout involving a 4-hour candle closure above the upper trendline could trigger the anticipated bullish bounce. This potential surge, according to price analysis, has the capacity to propel prices upwards by approximately 8%, leading to a retest of the $28,500 resistance.
However, prudence remains paramount as the overarching trend still displays negative undertones. Traders and cryptocurrency holders are urged to proceed cautiously at this resistance point, as the potential for sellers to regain bearish momentum persists, possibly resulting in an extended corrective phase.
Bitcoin (BTC) is currently trading at $25.928. Chart by TradingView.com
Understanding The Fear And Greed Index’s Significance
In a sentiment-driven market, the Crypto Fear and Greed Index holds substantial importance. It offers valuable insights into the collective psychological state of investors and traders, shedding light on their overall outlook.
A prolonged presence within the lower spectrum, exemplified by the current fear score of 39/100, underscores the prevailing apprehension and uncertainty among market participants. This underscores the need for judicious decision-making amidst the interplay of technical patterns and market sentiment.
The sustained position of the Crypto Fear and Greed Index within the fear zone, coupled with Bitcoin’s price dynamics marked by the falling parallel channel, underscores the intricate interplay of forces within the cryptocurrency market.
As traders closely monitor the potential breakout and its potential repercussions, exercising caution remains pivotal in navigating this intricate landscape.
(This site’s content should not be construed as investment advice. Investing involves risk. When you invest, your capital is subject to risk).
Featured image from Makersplace


