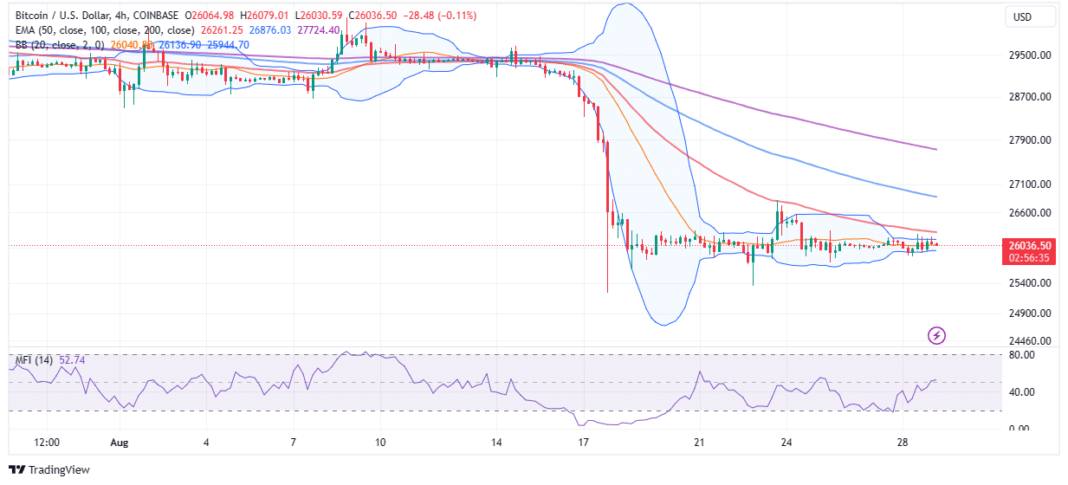
BTC price is not bearish towards the end of the Asian business hours on Tuesday, but it is not bullish either. The largest crypto, with $507 billion in market capitalization, has remained pivotal at $26,000 following a failed attempt to break resistance at $27,000 late last week.
Another failed rebound could confirm growing concerns in the market that Bitcoin may have to drop below $30,000 before making a valid bid for highs above $30,000.
BTC Price Is Close To A Breakout
There are vivid signs of a breakout approaching in BTC price based on the four-hour chart. The Bollinger bands indicator can be seen squeezing – an occurrence that often characterizes the period before a breakout.
The main apprehension is that the breakout could start out bearish with BTC price tumbling below $25,000 before resuming the uptrend above $30,000.

Another downward swing would become apparent if BTC price slips below the lower Bollinger band limit. In addition to jeopardizing the short-term support, such a move would put more pressure on the next buyer congestion at $25,000.
A sustained break below the critical $25,000 level is likely to increase the chances of losses stretching to $23,500, a region where many traders are likely to seek exposure to BTC while looking forward to a stronger climb beyond $30,000.
That said, extended losses to $20,000 cannot be ruled out, especially with market watchers already anticipating another rate hike by the United States Federal Reserve. The speech by Fed Chair Jerome Powell last week indicated that there was a need for another round of rate hikes.
The regulator’s hawkish stance on monetary policy depends on various economic indicators taking into account indexes like the Consumer Price Index (CPI), which suggested in August that inflation is still an issue.
In case of another rate hike in September, Bitcoin would struggle to hold above $25,000, thus significantly increasing the probability of another sell-off to $23,500 and if push comes to shove $20,000.
Exploring The Hidden Bullish Case In BTC Price
Despite the drop to $25,000 support nearly a couple of weeks ago, “larger volume holders show unwavering confidence,” IntoTheBlock, an on-chain analytics platform reports.
“There was a positive netflow for large holders of 24.08k $BTC on Aug 18 & 16.37k on Aug 23—right around the $26k mark.”
This in addition to the drop in the supply on exchanges as discussed in the previous BTC price analysis, reveals that investor sentiment is still positive and a recovery will occur sooner than later.
Bitcoin might abandon the anticipated drop below $25,000 if the Money Flow Index (MFI) holds the uptrend above the midline intact. The MFI compares the inflow and outflow volume of money into the BTC markets. Therefore, an uptrend suggests that investors are ready to throw their weight behind BTC price, betting on an immediate rebound toward $30,000.
Some hurdles traders should prepare for include the 50-day Exponential Moving Average (EMA) (red) at $26,262, the 100-day EMA (blue) at $26,876, and the 200-day EMA (purple) at $27,724.
Related Articles
The presented content may include the personal opinion of the author and is subject to market condition. Do your market research before investing in cryptocurrencies. The author or the publication does not hold any responsibility for your personal financial loss.


