


Ethereum price is struggling to recover above $1,650 against the US Dollar. ETH is showing bearish signs and might dive below the $1,600 support.
- Ethereum failed to gain strength for a move above the $1,650 zone.
- The price is trading below $1,640 and the 100-hourly Simple Moving Average.
- There are two bearish trend lines forming with resistance near $1,630 and $1,640 on the hourly chart of ETH/USD (data feed via Kraken).
- The pair could accelerate lower if the bears push it below the $1,600 support.
Ethereum Price Remains At Risk
Ethereum’s price attempted a recovery wave from the $1,600 support zone. ETH price climbed above the $1,630 level but the bears were active near the $1,650 zone, like Bitcoin.
The price is again moving lower and showing bearish signs. There are also two bearish trend lines forming with resistance near $1,630 and $1,640 on the hourly chart of ETH/USD. Ether is now trading below $1,640 and the 100-hourly Simple Moving Average.
On the upside, the price might face resistance near the $1,630 level and the first trend line. The next resistance is near the $1,640 level, the second trend line, and the 100 hourly SMA. It is close to the 23.6% Fib retracement level of the downward move from the $1,750 swing high to the $1,600 low.
A close above the $1,640 level might send the price toward the $1,670 zone. The main resistance is now forming near $1,700 or the 61.8% Fib retracement level of the downward move from the $1,750 swing high to the $1,600 low.
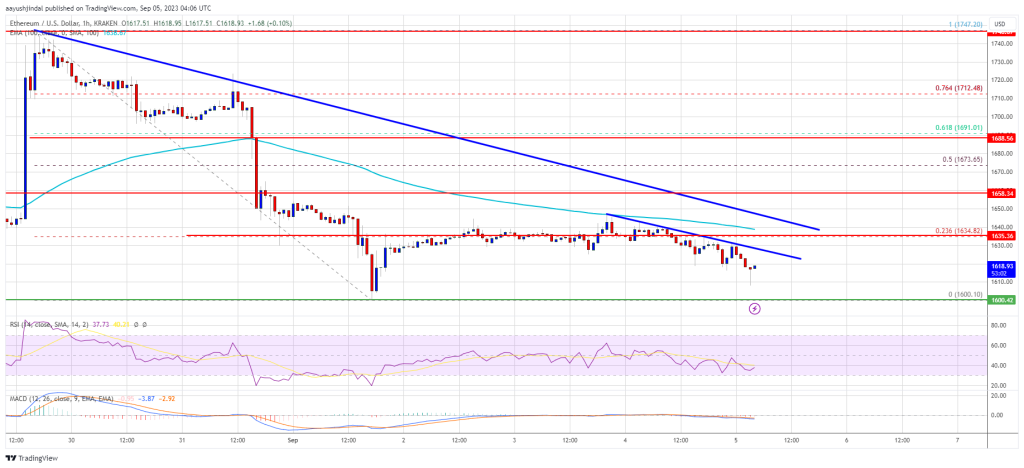
Source: ETHUSD on TradingView.com
To start a fresh increase, Ethereum must settle above the $1,700 resistance zone. The next resistance might be near $1,750. Any more gains might send the price toward the $1,800 resistance.
More Losses in ETH?
If Ethereum fails to clear the $1,640 resistance, it could continue to move down. Initial support on the downside is near the $1,610 level.
The first key support is close to $1,600. The next major support is near the $1,580 level. If there is a downside break below $1,580, the price could accelerate lower toward the $1,540 level. Any more losses might send the price toward the $1,480 level.
Technical Indicators
Hourly MACD – The MACD for ETH/USD is gaining momentum in the bearish zone.
Hourly RSI – The RSI for ETH/USD is now below the 50 level.
Major Support Level – $1,600
Major Resistance Level – $1,640


 Reattempts Breakout, Bulls Eye Strong Rally Move")


