


Ethereum price is eyeing an upside break above $1,650 against the US Dollar. ETH could gain bullish momentum if it clears $1,650 and $1,670 in the near term.
- Ethereum is slowly moving higher above the $1,620 support zone.
- The price is trading above $1,640 and the 100-hourly Simple Moving Average.
- There is a key bullish trend line forming with support near $1,625 on the hourly chart of ETH/USD (data feed via Kraken).
- The pair could start a decent increase if there is a close above the $1,650 and $1,670 resistance levels.
Ethereum Price Eyes Upside Break
Ethereum’s price remained stable above the $1,620 support zone. ETH formed a base and made another attempt to clear the $1,650 resistance, like Bitcoin.
There was a spike above the $1,650 resistance zone but the bulls struggled near the next hurdle at $1,670. A high was formed near $1,669 before the price trimmed gains. It traded below the $1,650 level. The bears pushed it below the 50% Fib retracement level of the upward move from the $1,625 swing low to the $1,669 high.
However, the bulls protected the $1,640 zone. It is close to the 61.8% Fib retracement level of the upward move from the $1,625 swing low to the $1,669 high.
Ether is now trading above $1,640 and the 100-hourly Simple Moving Average. Besides, there is a key bullish trend line forming with support near $1,625 on the hourly chart of ETH/USD. On the upside, the price might face resistance near the $1,650 level.
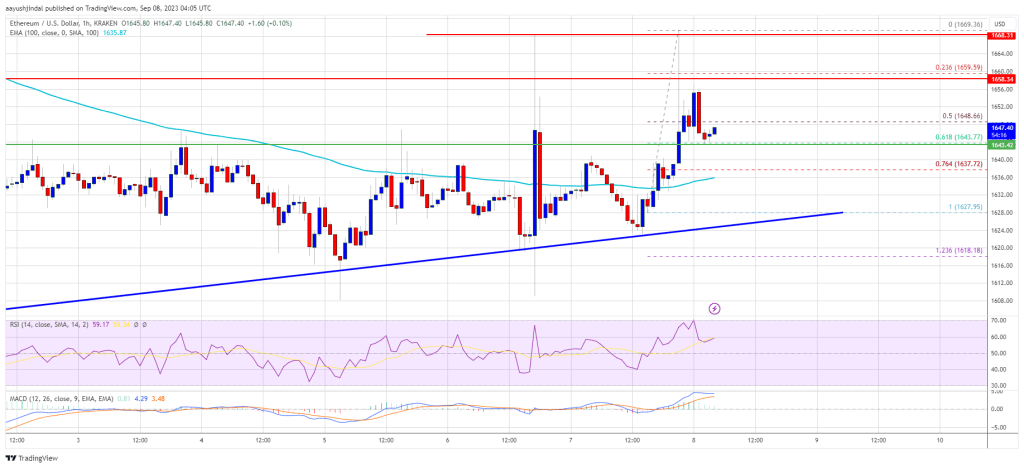
Source: ETHUSD on TradingView.com
The next resistance is near the $1,670 level, above which the price could rise toward the $1,720 level. The next major hurdle is near the $1,750 level. A close above the $1,750 level might send Ethereum further higher. The next resistance might be near $1,820. Any more gains might send the price toward the $1,880 resistance.
Another Decline in ETH?
If Ethereum fails to clear the $1,670 resistance, it could start another decline. Initial support on the downside is near the $1,642 level.
The first key support is close to $1,635 and the 100-hourly Simple Moving Average. The next key support is $1,625 and the trend line. A downside break below $1,625 might push it to $1,600. If there is a downside break below $1,600, the price could revisit the key $1,540 support level.
Technical Indicators
Hourly MACD – The MACD for ETH/USD is slowly gaining momentum in the bullish zone.
Hourly RSI – The RSI for ETH/USD is now above the 50 level.
Major Support Level – $1,625
Major Resistance Level – $1,670


