


On-chain data shows the Ethereum daily active addresses indicator has recently registered its second-highest spike.
Ethereum Daily Active Addresses Has Observed A Sharp Spike Recently
According to data from the on-chain analytics firm Santiment, the active addresses metric only achieved a higher value in December 2022. The “daily active addresses” indicator measures the daily total number of unique Ethereum blockchain addresses that interact in some way.
This metric naturally accounts for both senders and receivers. Note that “unique” means that even if an address makes several transactions in a single day, its contribution towards the active addresses metric will remain just one unit.
The benefit of this restriction is that unique addresses can be considered analogous to unique users, so the indicator’s value can provide hints about the amount of traffic the ETH blockchain has received during the past day.
When the metric has a high value, many users are now interacting with the network. This can signify that the traders are actively interested in making moves on the asset.
Now, here is a chart that shows the trend in the Ethereum daily active addresses over the past few months:
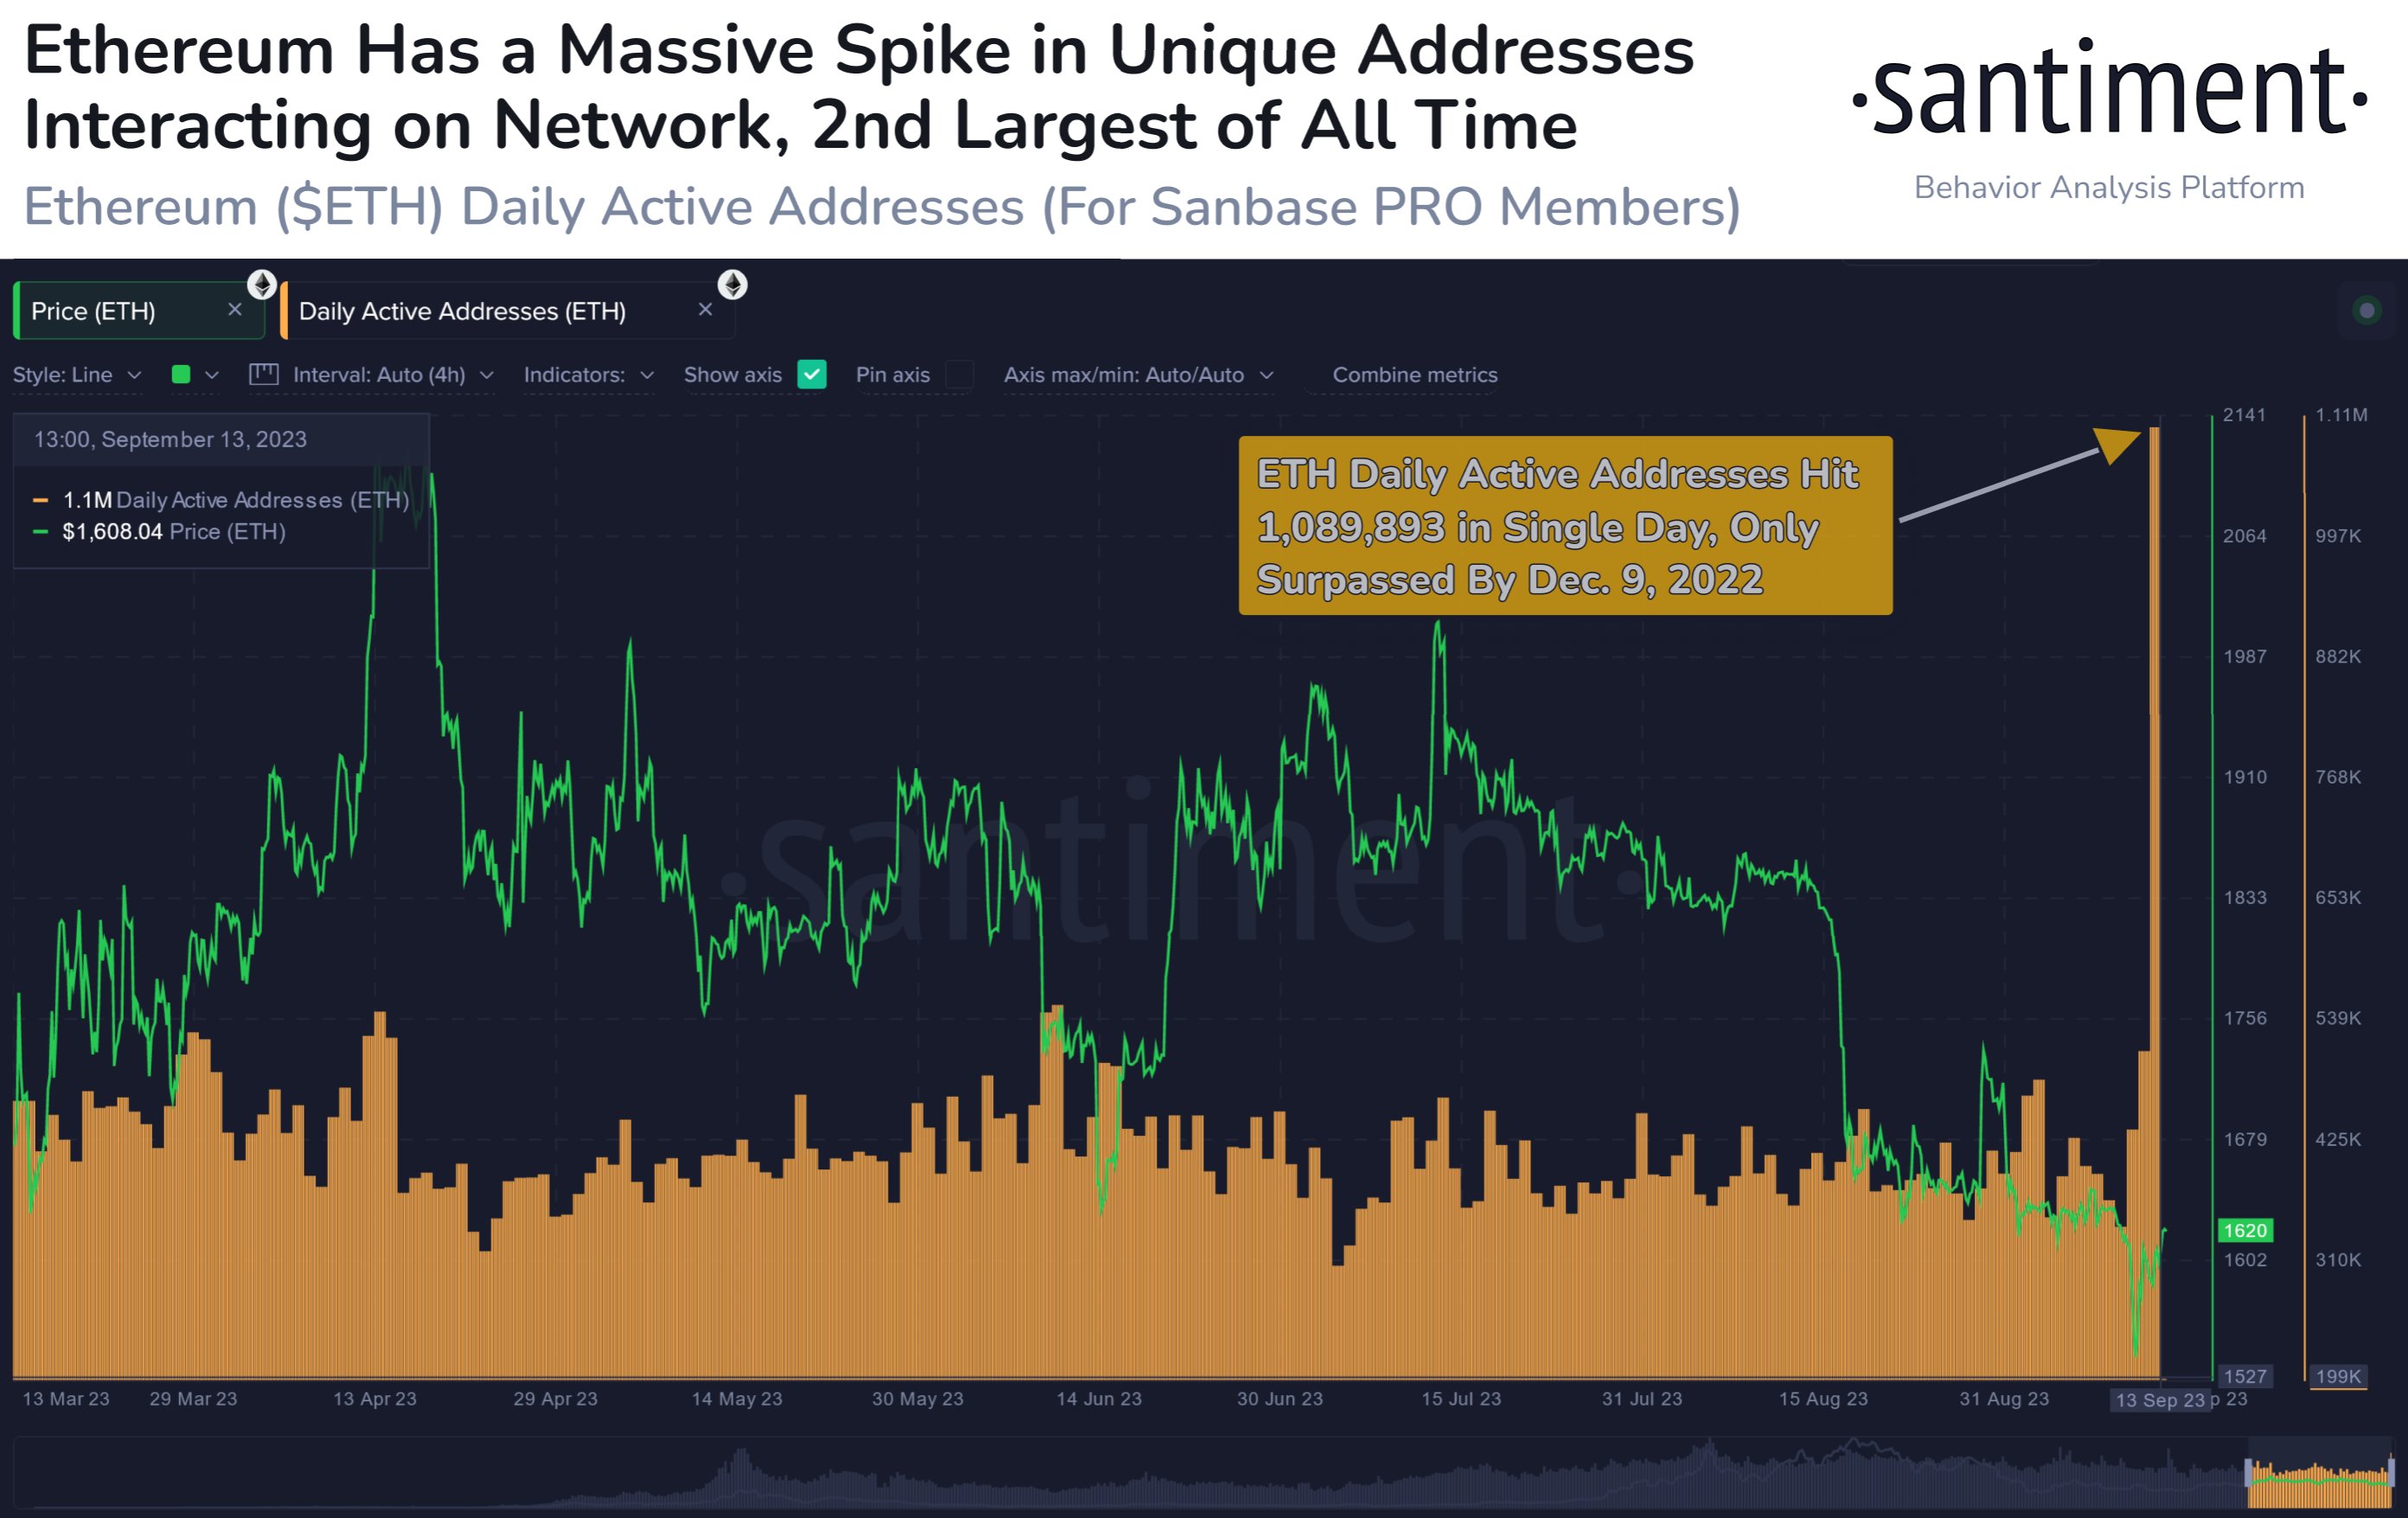
Looks like the value of the metric has been quite high in recent days | Source: Santiment on X
As displayed in the above graph, the Ethereum daily active addresses indicator has seen a value of more than one million during the past day. This would imply that more than a million users have just made a move on the blockchain.
This is an extremely high value and is, in fact, the second highest that the metric has observed in the eight years or so of the cryptocurrency’s history. The all-time high of the indicator (that is, the only time the indicator had been higher) was registered on December 9, 2022.
Interestingly, back then, Ethereum had been in the post-FTX crash lows, and as it has turned out, that period was the bear market bottom for the asset. It’s possible that the sudden reignition of interest in the coin was what helped it hit the bottom and gear up for the rally that would start in January 2023.
During the past few months, the indicator’s value has remained relatively low as investors have held low interest in the asset. With this latest spike, though, things have changed in a flash.
Suppose the example of the December active addresses spike is anything to go by. In that case, Ethereum may be able to turn itself around off the back of this latest elevation in user activity.
ETH Price
Ethereum has continued to show overall flat movement during the past week as ETH is still trading around $1,600.
ETH has bounced quickly from its lows | Source: ETHUSD on TradingView
Featured image from Bastian Riccardi on Unsplash.com, charts from TradingView.com, Santiment.net


