


Bitcoin price is struggling to rise above the $27,800 resistance zone. BTC could extend its decline if there is a clear move below the $27,200 support zone.
- Bitcoin is struggling to start a fresh increase above the $27,800 resistance zone.
- The price is trading below $27,700 and the 100 hourly Simple moving average.
- There was a break below a key rising channel with support near $27,650 on the hourly chart of the BTC/USD pair (data feed from Kraken).
- The pair could start another decline if there is a close below the $27,200 support.
Bitcoin Price Faces Uphill Task
Bitcoin price attempted a fresh increase from the $27,200 support zone after a downside correction. BTC managed to recover above the $27,500 resistance zone.
The price climbed above the 50% Fib retracement level of the downward move from the $28,565 swing high to the $27,189 low. However, the bears remained active near the $28,000 resistance zone. The price struggled to settle above the $27,850 level.
Bitcoin got rejected near the 61.8% Fib retracement level of the downward move from the $28,565 swing high to the $27,189 low. It saw a fresh decline below $27,500.
Besides, there was a break below a key rising channel with support near $27,650 on the hourly chart of the BTC/USD pair. The bulls are now protecting the $27,200 support zone. It is trading below $27,700 and the 100 hourly Simple moving average.
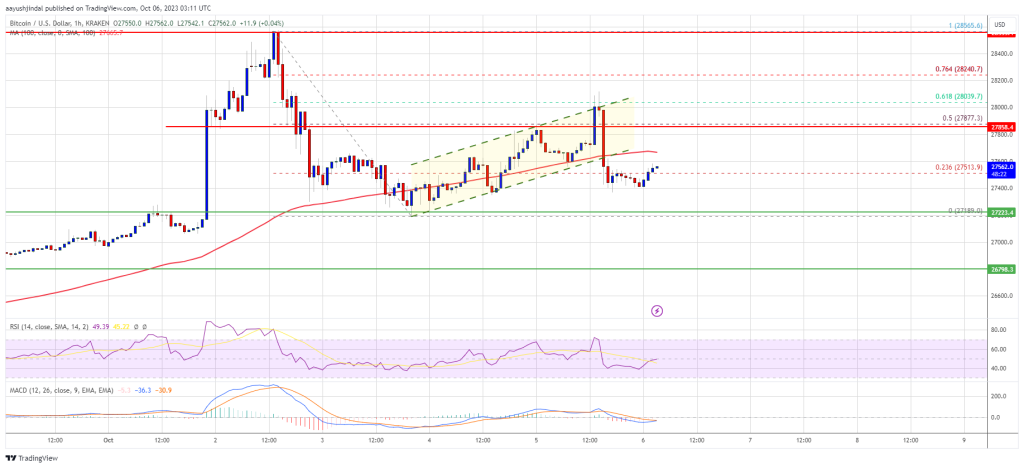
Source: BTCUSD on TradingView.com
Immediate resistance on the upside is near the $27,650 level. The next key resistance could be near the $28,000 level. A close above the $28,000 resistance could start another increase. In the stated case, the price could rise toward the $28,500 resistance. Any more gains might call for a move toward the $29,200 level.
More Losses In BTC?
If Bitcoin fails to continue higher above the $27,800 resistance, there could be more losses. Immediate support on the downside is near the $27,400 level.
The next major support is near the $27,200 level. A downside break and close below the $27,200 level might push the price further lower toward $26,800 in the near term. The next support sits at $26,200.
Technical indicators:
Hourly MACD – The MACD is now losing pace in the bearish zone.
Hourly RSI (Relative Strength Index) – The RSI for BTC/USD is now near the 50 level.
Major Support Levels – $27,400, followed by $27,200.
Major Resistance Levels – $27,800, $28,000, and $28,500.


