


Ethereum price is correcting gains from the $2,440 zone. ETH is correcting gains, but the bulls might remain active near the $2,300 and $2,240 support levels.
- Ethereum is correcting gains and trading below the $2,400 level.
- The price is trading above $2,320 and the 100-hourly Simple Moving Average.
- There is a bullish flag forming with resistance near $2,360 on the hourly chart of ETH/USD (data feed via Kraken).
- The pair could start a fresh increase if there is a close above the $2,400 level.
Ethereum Price Remains Supported
Ethereum price climbed higher above the $2,320 resistance zone. ETH even broke the $2,400 level before the bears appeared. A high was formed near $2,441 before the price started a downside correction, like Bitcoin.
There was a move below the $2,400 and $2,380 levels. The price declined and tested the 50% Fib retracement level of the upward wave from the $2,180 swing low to the $2,441 high. The bulls seem to be active near the $2,320 support zone.
Ethereum is now trading above $2,320 and the 100-hourly Simple Moving Average. On the upside, the price is facing resistance near the $2,360 level. There is also a bullish flag forming with resistance near $2,360 on the hourly chart of ETH/USD.
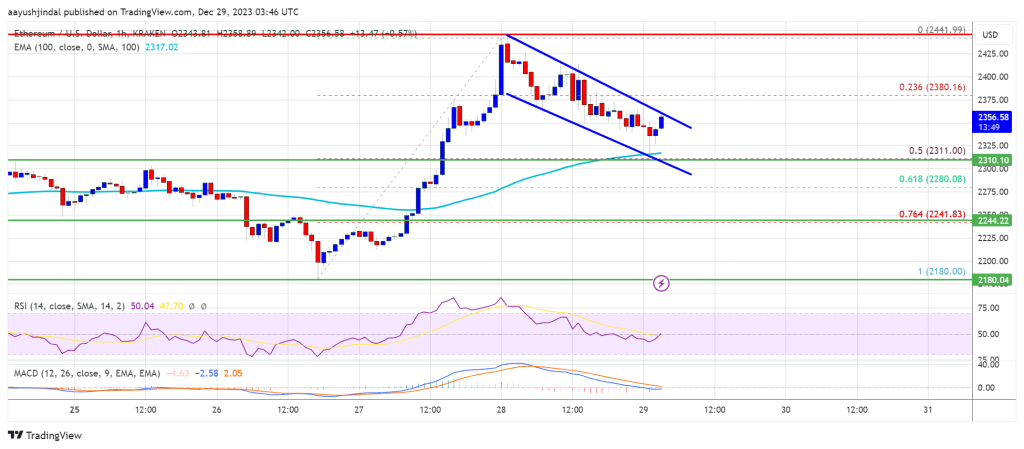
Source: ETHUSD on TradingView.com
The first major resistance is now near $2,400. A close above the $2,400 resistance could send the price toward $2,440. The next key resistance is near $2,500. A clear move above the $2,500 zone could start another increase. The next resistance sits at $2,620, above which Ethereum might rally and test the $2,750 zone.
More Losses in ETH?
If Ethereum fails to clear the $2,400 resistance, it could continue to move down. Initial support on the downside is near the $2,320 level and the 100 hourly SMA.
The first key support could be the $2,240 zone or the 76.4% Fib retracement level of the upward wave from the $2,180 swing low to the $2,441 high. A downside break and a close below $2,240 might start another major decline. In the stated case, Ether could test the $2,165 support. Any more losses might send the price toward the $2,120 level.
Technical Indicators
Hourly MACD – The MACD for ETH/USD is losing momentum in the bullish zone.
Hourly RSI – The RSI for ETH/USD is now near the 50 level.
Major Support Level – $2,320
Major Resistance Level – $2,400
Disclaimer: The article is provided for educational purposes only. It does not represent the opinions of NewsBTC on whether to buy, sell or hold any investments and naturally investing carries risks. You are advised to conduct your own research before making any investment decisions. Use information provided on this website entirely at your own risk.


 Reattempts Breakout, Bulls Eye Strong Rally Move")


